Market Snapshot Example 1
Picking Pairs & Strategies: Market Snapshot Example 1
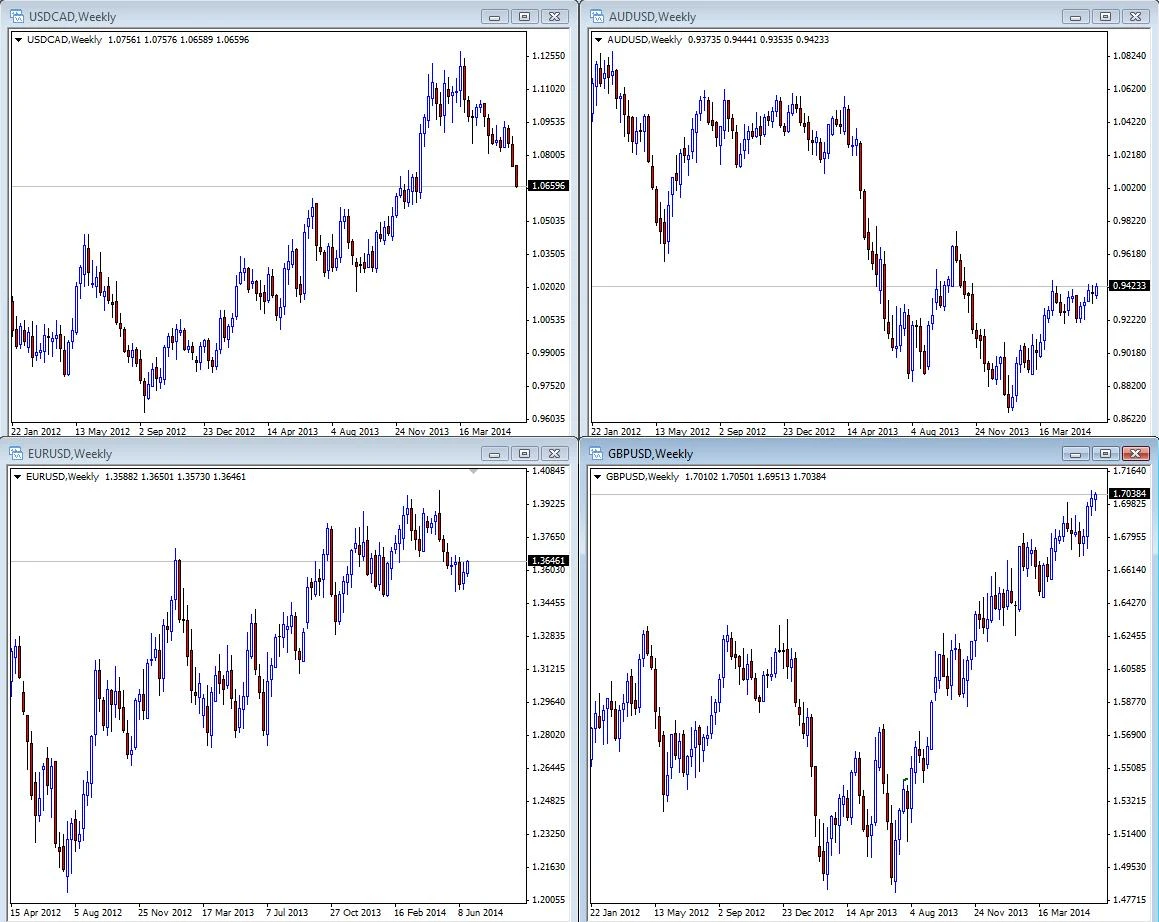
Based on actual trading data from June 29, 2014. Using a variety of technical and fundamental analytical tools, we examine a range of major and minor currency pairs over the weekend, determining from a review of technical charts and forthcoming economic events where likely trade decision points are going to arise. Noting these points, our ongoing analysis determines which strategy should be best used in each particular case to take advantage of any trade opportunity.

Market Snapshot Example 1
Subjects Covered:
- Multiple Time Frame Coordination
- Signal Candles
- Time of Day
- Position of Support/Resistance
- News Impact
Weekend Review 1
I think the key to success in trading is in understanding the markets’ behavior. That is why I sit in front of my computer and study the charts. Each trade I take should have a solid reason (fundamentally or technically), or else it wouldn’t be any different than gambling.

Weekend Review 2
If you plan your trade and trade your plan, you are going in the right direction. Of course, there are lots of currency pairs you can trade, but you have to find the ones giving you better opportunities.
You can study the charts over the weekends and search for price formations, candlestick patterns, mark important support/resistance levels; i.e. plan your trade according to the strategy you are following.
Weekly News Calendar
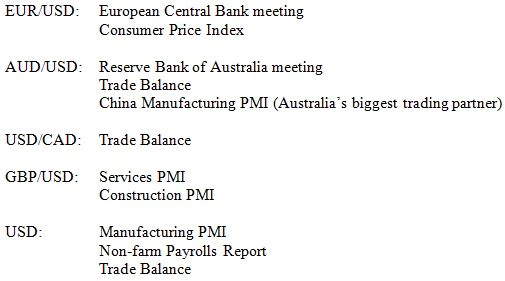
Here is what I did on the chart after a short observation. The next thing I do is to check the weekly economic calendar and find out if there are any high impact report releases which might affect the pairs I picked.
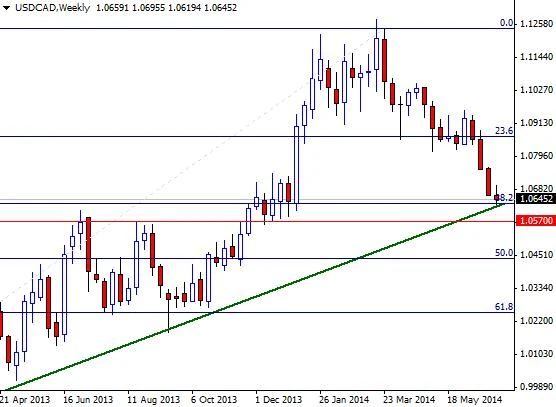
USD/CAD
Now let’s inspect the charts closely:
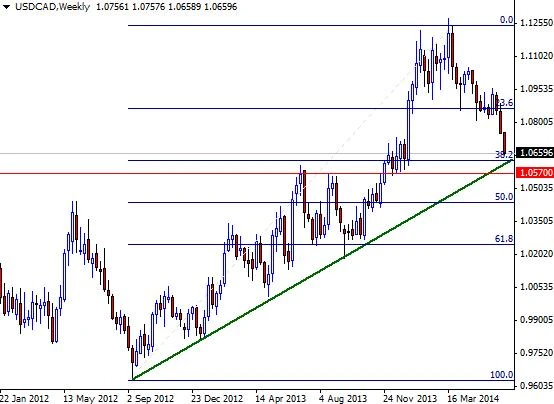
This pair is certainly coming to a crossroads. The market is approaching a long-term ascending trend line and there are 2 other elements converging around that area: a former support resistance and a 38.2 Fibonacci.
Options:
– Open a short position…the pair is going to break and will drop like a rock!
– Open a long position if prices reach the trend line…support is strong, the pair will reverse once again!
– Wait and see whether the support will hold or give way and decide afterwards!
AUD/USD
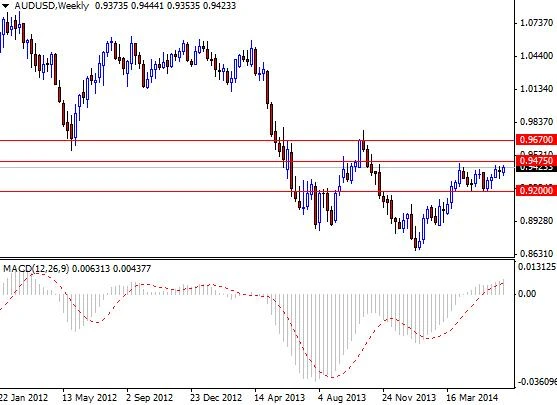
The AUD/USD pair has been range bound for some time. It looks like the pair will head towards 0.9670 if it can break through the resistance at 0.9475. Maybe the RBA’s announcement or manufacturing data from China could be the catalyst that the bulls need. However, if the floor at 0.9200 disappears, things could shift to the bears.
Options:
– Open a short position if the pair hits the 0.9475 level.
– Open a long position right away…we are going to break through this time!
– Wait for a break out (go long on a sustained break above 0.9475 targeting somewhere near 0.9670, go short if the pair closes below 0.9200) or a reversal sign if the pair tests 0.9745.
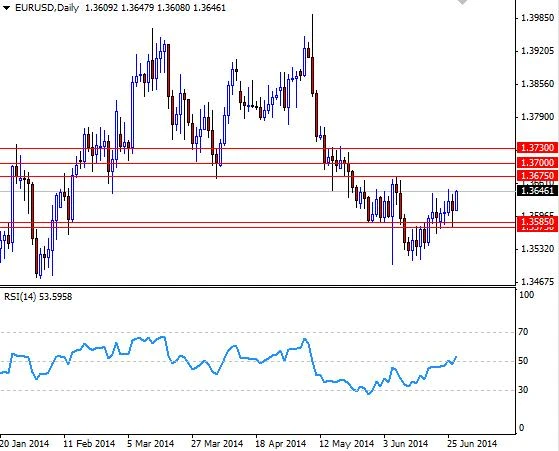
EUR/USD
The EUR/USD pair had difficulty with the 1.40 level and dropped sharply after the ECB’s rate decision. It appears that there is a significant amount of support around the 1.35 level and recently the pair managed to hold above the 1.3475-1.3585 zone. That means any close below this area would be negative. Although I don’t use RSI as a part of my trading system, I pay attention to irregularities, breakouts or triangle/wedge formations. Based on the pair’s tendency to trade above 1.3475-1.3585 (and the fact that RSI has been strong recently), expecting the pair to test the 1.3675 would be reasonable. Besides, the Euro usually sees support ahead of the ECB meetings. Meanwhile keep an eye on the CPI data because deflation is a major source of worries.
Options:
– Go long targeting 1.3675, 1.3700 and 1.3730.
– Sell at 1.3675 or buy around 1.3585.
– Wait for a break out (go long on a sustained break above 1.3675 targeting 1.3700 and 1.3730, go short if the pair closes below 1.3475 with a target of 1.3520).

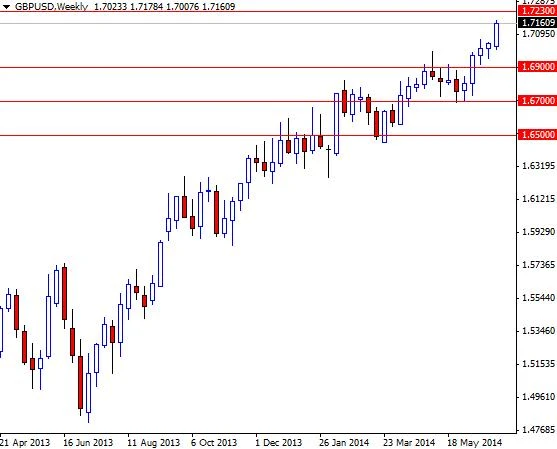
GBP/USD
The British pound has been gaining ground against the American dollar steadily. It appears that market participants are fixated on the Bank of England’s future plans and now people believe that the central bank will increase interest rates sooner and faster than previously thought. As a result, the GBP/USD pair reached its highest level in 4 years. Even if you are not a long term trader, sometimes you should check weekly/monthly charts to see the broader trend. If you are trading GBP/USD pair, it would be wise to keep an eye on the EUR/GBP pair as well.
Speaking strictly based on the chart, the pair still has more room to the upside and it looks like 1.7230 will be tested within the next couple of months as long as the 1.6700 support holds. If this support is broken, selling pressure could increase. That means the bears will be aiming for 1.6520.
Options:
– Go long targeting 1.7230…nothing can stop the sterling!
– Wait for a pullback and go long around 1.6900 after a supportive candle.
– Go short if the 1.6900 support is broken targeting 1.6835 and 1.6700.

Now Plan Your Trade
Now plan your trade(s)…There is one more thing to think about: if you can carry 2 positions at a time, which plan (pair) would you choose? Since you can’t open too many positions, you will have to decide which pair(s) would be more profitable.

2nd Weekend Review
Last week, we picked 4 currency pairs and applied some of the technical analysis methods to decide what to do (deciding what not to do is as important as what to do, if you want to be a successful trader). Today, we are going to put these pairs under the microscope.
Last week, the USD/CAD was approaching a long term ascending trend-line and there were 2 other elements converging around that area: 38.2 Fibonacci (based on the bullish run from 0.9632 to 1.1255) and a former support / resistance.
USD/CAD 2
Now let’s look at what happened next.
The pair tested the ascending trend-line but failed to break below. Do you think this was surprising? I don’t think so.
I think this is a good example explaining why we should “Wait and see whether the support will hold or give way and decide afterwards!”

AUD/USD 2
The AUD/USD pair has been consolidating for quite some time due to lack of a strong catalyst. Let’s see whether that situation changed…or not.
The pair headed higher after the RBA (Reserve Bank of Australia) announcement but failed to hold on the gains and reversed on the back of the solid U.S. economic figures.
It seems that the best option was to “Wait for a break out (go long on a sustained break above 0.9475 targeting somewhere near 0.9670, go short if the pair closes below 0.9200) or a reversal sign if the pair tests 0.9745”.

EUR/USD 2
Last week, I said that expecting EUR/USD to test 1.3675 would be reasonable. There were two main reasons behind that forecast: the pair’s tendency to trade above 1.3475-1.3585 (and the fact that RSI has been strong recently) and the Euro’s behavior ahead of the ECB meetings (Although I don’t trade based on statistical data, I don’t ignore them either). Now let’s check what happened.
The pair traded as high as 1.3700 but the bulls failed to overcome the resistance there. Of course, the European Central Bank meeting and upbeat U.S. jobs report played important role as well.
If you were long at the beginning of the week targeting “1.3675, 1.3700 and 1.3730” or you sold at 1.3675, you might have made some money.
GBP/USD 2
When we talked about this pair one week ago, I tried to explain why traders should take a look at the long term charts (such as weekly and monthly) even if they don’t carry positions for days. It is important (or at least easier) to follow a strong trend. From a technical perspective, GBP/USD charts were pointing higher prices. Did the pair end the week higher?
As you can see, the GBP/USD pair continued to climb and closed the week at 1.7160. It looks like your best option was “Go long targeting 1.7230”. You might want to have a look at the EUR/GBP chart to understand the relative strength difference between the British pound and Euro.
3rd Weekend Review - Part 1
I think mastering technical analysis is the first logical step into the right direction. Acquiring the necessary knowledge to start trading in the forex market could take a few months of hard work. But of course trading is not clicking the buy or sell buttons only. Trading is also a mind game that most traders find hard to overcome. Some people find it easy to follow the decisions they make, some just can’t do it.
3rd Weekend Review - Part 2
The decision making process decides the outcome of the market operations of a trader. Plan your trade and trade your plan. This week, we got another 4 pairs to analyze. We are going to inspect each of them and see our options.
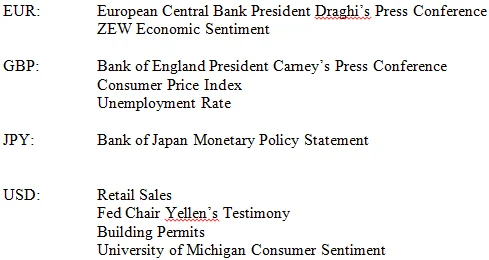
Weekly News Calendar 2
Here is what I did on the charts after a short observation. The next thing I do is to check the weekly economic calendar and find out if there are any high impact report releases which might affect the pairs I picked.

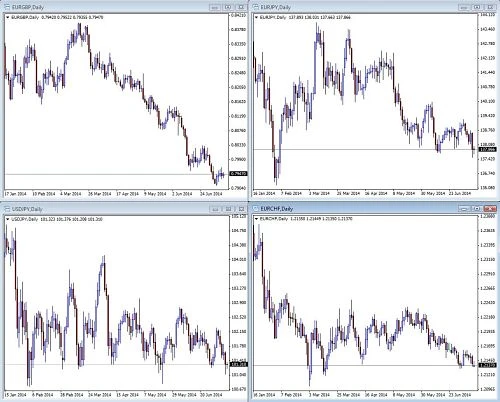
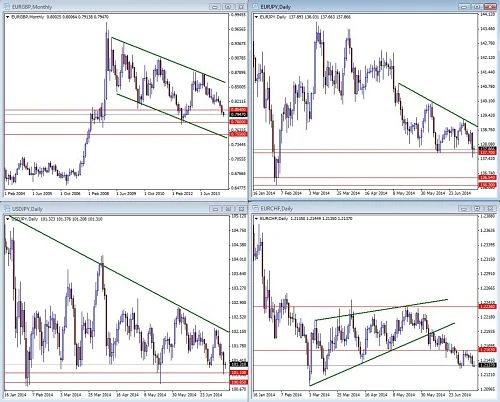
EUR/GBP
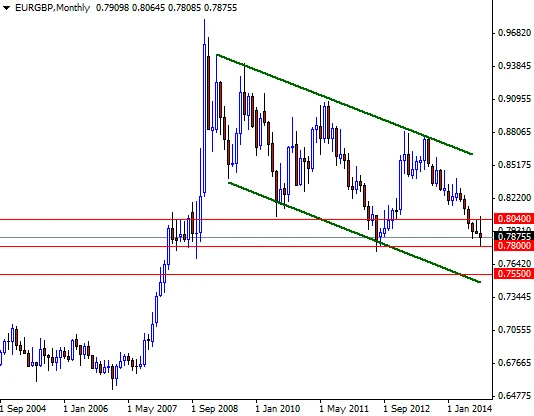
The reason I switched to the monthly chart is to show that this pair has been in a downtrend since 2009 and for the last couple of months growing conviction that strong economic data out of the UK would eventually prompt the Bank of England to shift to a more hawkish tone on interest rates has been driving this market’s bearish activity. Until the trend changes, I would prefer selling on rallies instead of buying on dips. Being in a downtrend doesn’t mean there won’t be retracements. However, catching counter moves might be too risky.
Options:
– Open a short position…The pair is going to hit 0.7800!
– Open a short position at 0.8040.
– Wait and see whether the support at 0.7800 will hold or give way and decide afterwards!
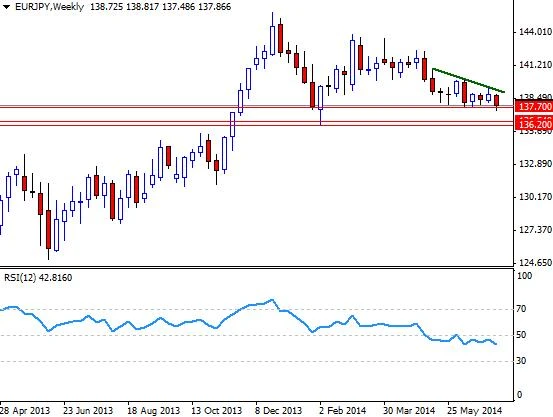
EUR/JPY
The Japanese yen was around the 130 level one year ago (July 2013). In July 2012 the pair traded as low as 94.10. Investors believed that Shinzo Abe’s government could end decades of deflation and boost economic growth (with Bank of Japan’s help of course).
However, after two years, recently the Japan government has been struggling to inspire the market and as a result this pair is having hard time gaining upward momentum. As you can see on the chart, the RSI keeps falling and there is a descending triangle forming but the support around the 137 level is acting as a floor.
Options:
– Open a short position if the pair closes below the 137 level on a daily basis.
– Open a long position…I believe the 137 support level is strong enough!
– Wait for prices to close above the green descending trend-line and go long.
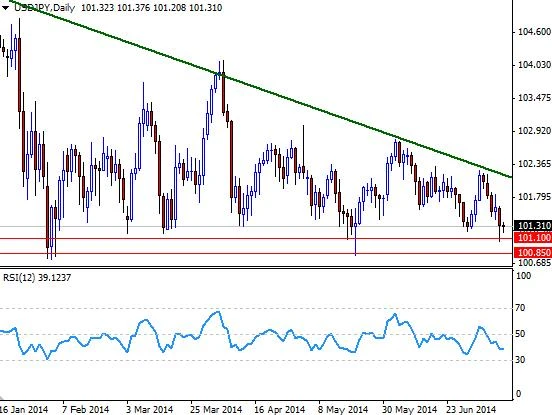
USD/JPY
This pair has been no different than the EUR/JPY pair but I wanted to pick two similar pairs this week so that I can talk about trading ranges and characteristics. According to data, average trading range (20 days) of the USD/JPY pair is 37 pips but average trading range (20 days) of the EUR/JPY pair is 55 pips. That means you should also consider characteristics of currency pair while determining lot size, stop-loss and take profit targets.
Options:
– Go long at 101.10 and 100.85 targeting the green line.
– Go short if the pair drops below 100.85.
– Wait and see whether the support will hold or give way and decide afterwards!

EUR/CHF
Pairs like EUR/CHF may not be a good choice for everyone because of their extremely narrow trading ranges. At first glance, you may think the EUR/CHF is moving well but if you look closely, you will realize that the market moved only 100 pip in the last 2 months! This pair has a very limited trading range because of the 1.20 floor introduced by the Swiss National Bank.
That means if you are shorting this pair, you are going against the central bank. However, we can take advantage of this situation. You just have to be patient.
Options:
– Go long if the pair breaks through 1.2163 targeting 1.2236.
– Go long if the pair hits 1.2102/0.
– Go short targeting March 3 low of 1.2102.

Now Plan Your Trade 2
Now plan your trade(s)…there is one more thing to think about: if you can carry 2 positions at a time, which plan (pair) would you choose? There reason I ask this is because there will be times you will have to decide what pair choice would be more profitable.
EUR/GBP 2
When we analyzed this pair some weeks ago, it was trading at the 0.7947 level. We had underlined that expectations are that UK monetary policy would begin to diverge from policy in Europe, and this has been weighing on the market. We also noted that the pair has been in a downtrend since 2009. In the end, we decided that selling on rallies was preferable to buying on dips.
Looks like following the trend wasn’t a bad decision after all. Opening a short position at 0.8040 and targeting the 0.7800 level would have given a nice profit. However, note that the pair traded as low as 0.7807 (we were out by 7 pips!).
