GBP/USD Trade
Demand Return Strategy Simulation: GBP/USD Trade
Based on actual trading data from June 13, 2013. Using the Demand Return strategy on a major currency pair, we monitor multiple indicators to define an S/R zone, dropping down to a lower time frame to try to find a low-risk entry. The Demand Return and DBB signals, strength of the trend, and position of support and resistance are considered before entering at a time of day that is appropriate to this pair. The trade stalls halfway to its profit target, and is impacted by important economic news releases, so the concepts of what constitutes a bad sign for a trade, and ways in which a trade can be managed according to changing circumstances, are considered.

GBP/USD Trade
Subjects Covered:
- Demand Return
- Bollinger Band Momentum
- Multiple Time Frame Coordination
- Signal Candles
- Time of Day
- Position of Support/Resistance
- 200 EMA
- Round Number
- News Impact
- Pivot Points
Signal 1
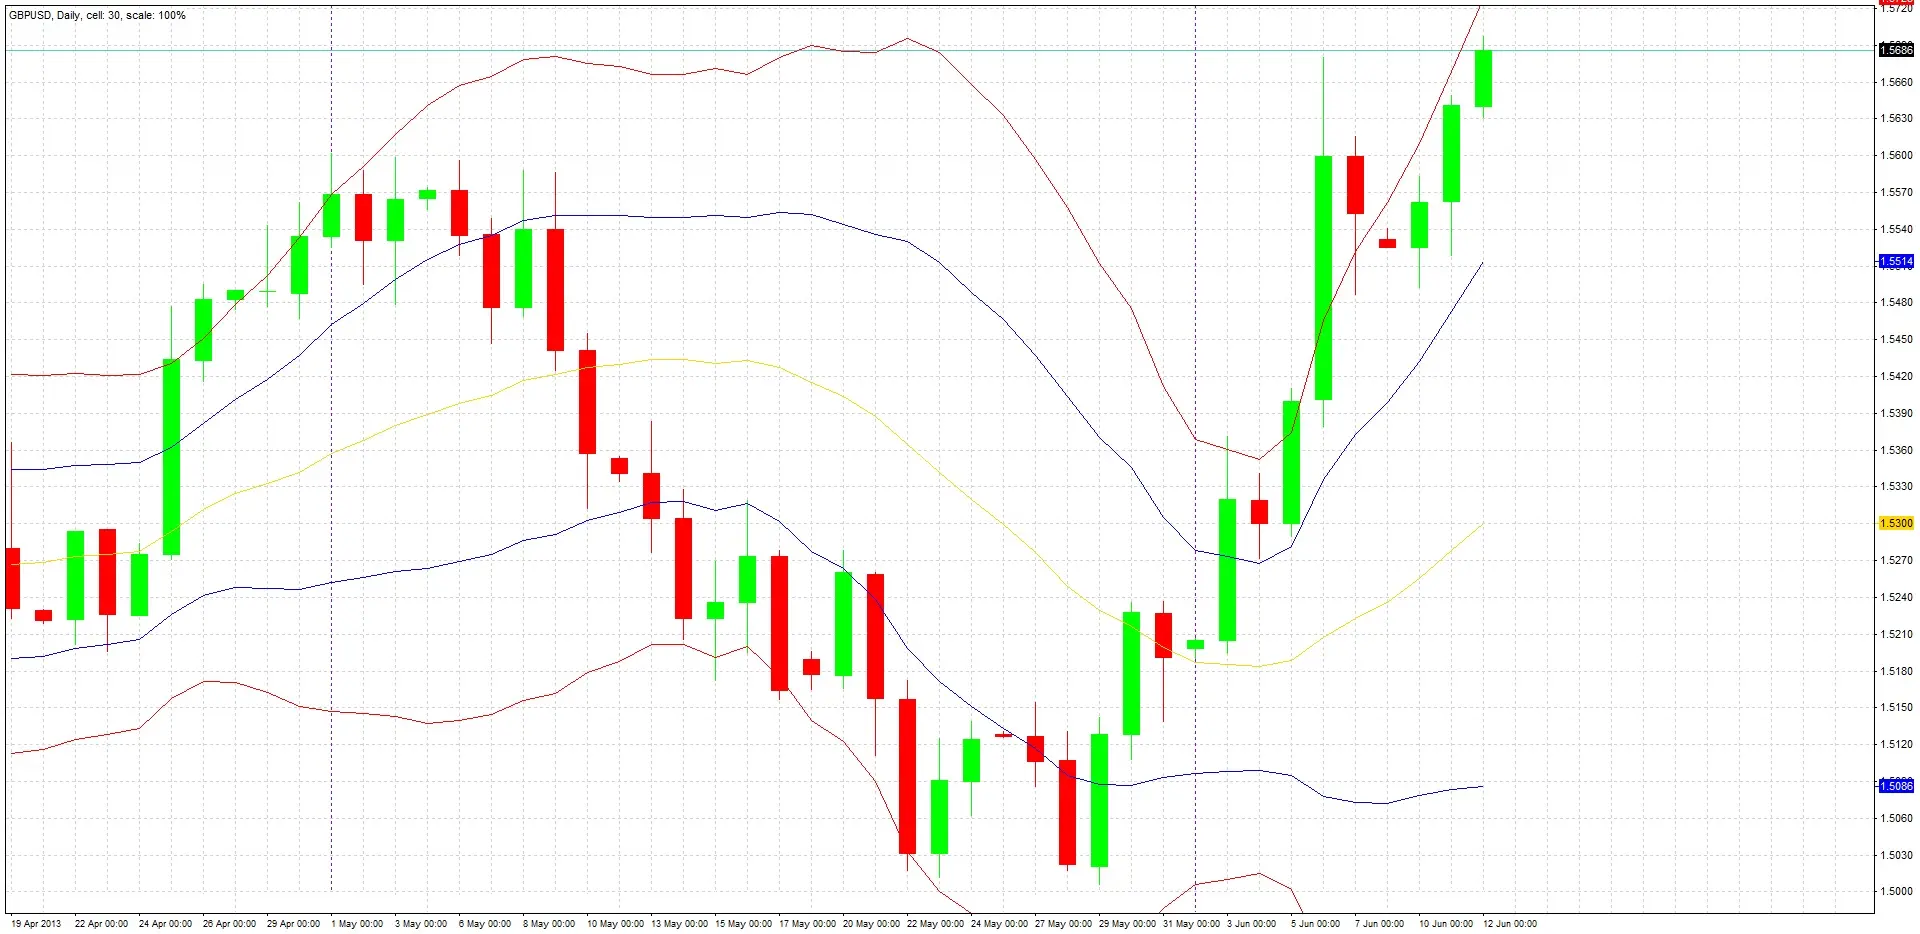
The price action of the daily candles shows two consecutive bullish candles. The close of the second candle is above the high of the first candle, and is also in the top half of its own range. This is a bullish signal. We should continue analyzing the daily chart.

Signal 2
DBBs applied to the daily chart show that the last 7 days have formed entirely within the buy zone and are pushing against the upper band’s line, this is a sign of a bullish trend. We should look at the trend more carefully.
Signal 3
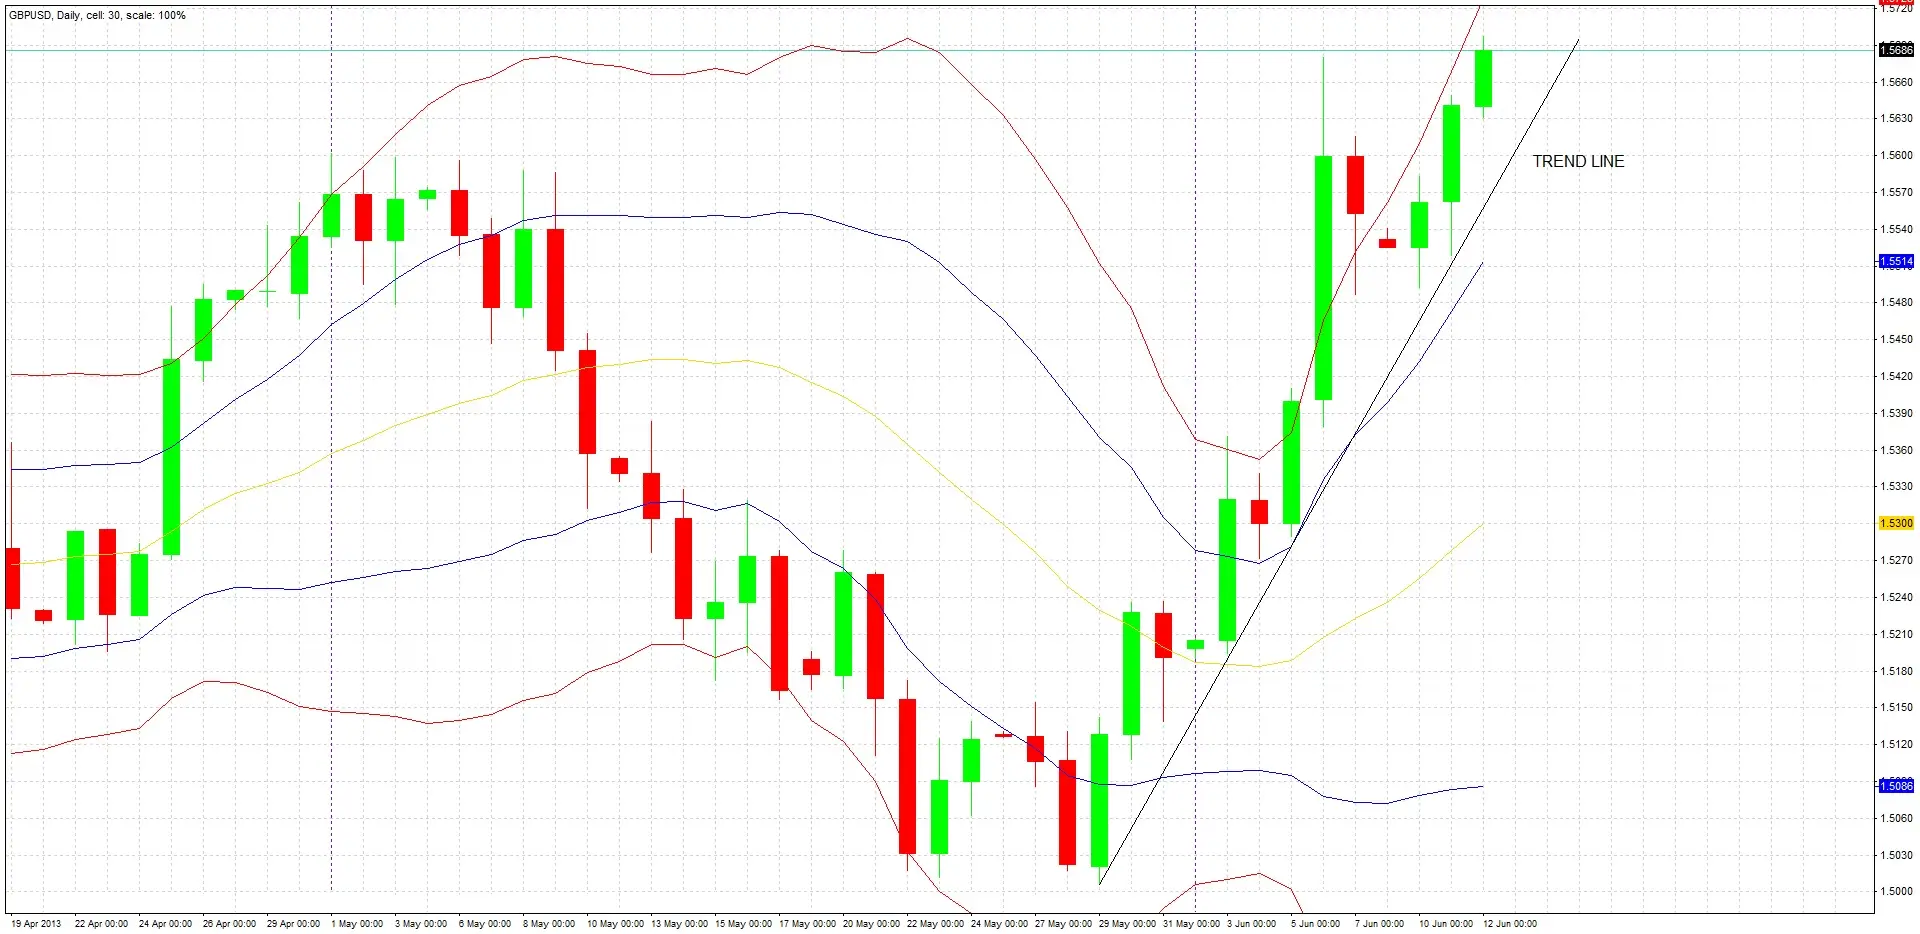
We can see that this bullish trend has been held by a steep lower trend line, and that almost all the recent candles have been strongly bullish. Next we should look to see if there are any reasons to be cautious about looking for a long trade here.
Caution?
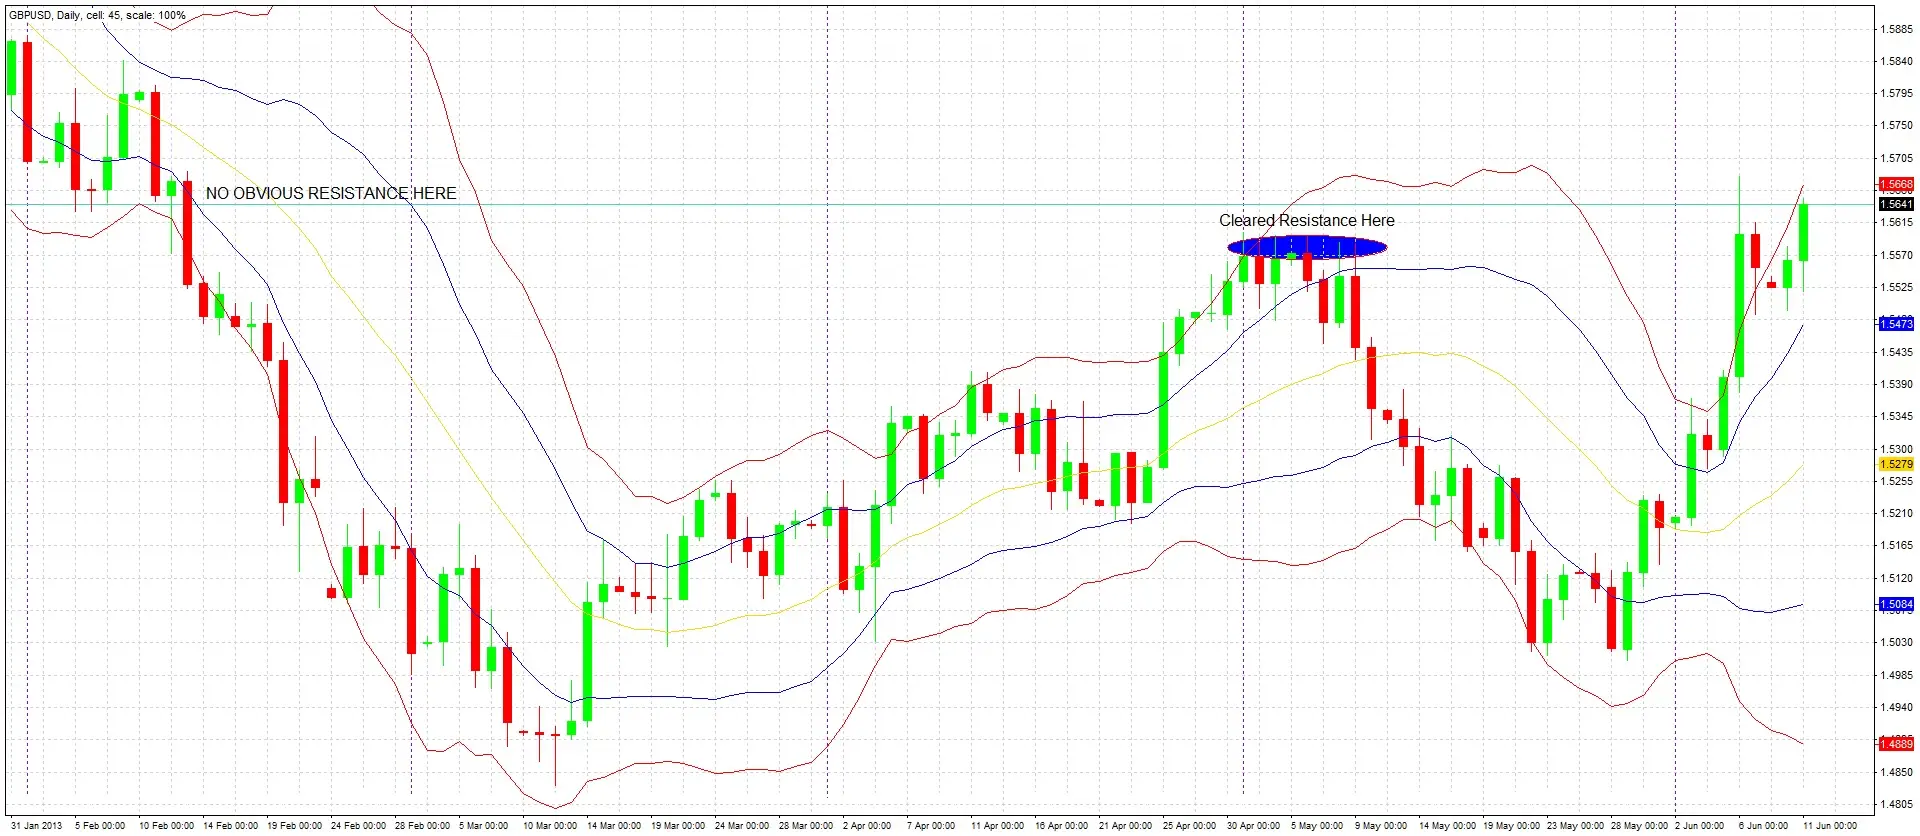
We look to the left to see what was happening when the price was last in this area. We can see from the chart that we have cleared a zone of resistance at around 1.56 that was established in early May. We can also see that when the price as last at its current level early in February, the price moved up and down around this area, so there is no obvious resistance overhead.
Begin Monitoring Lower Time Frame
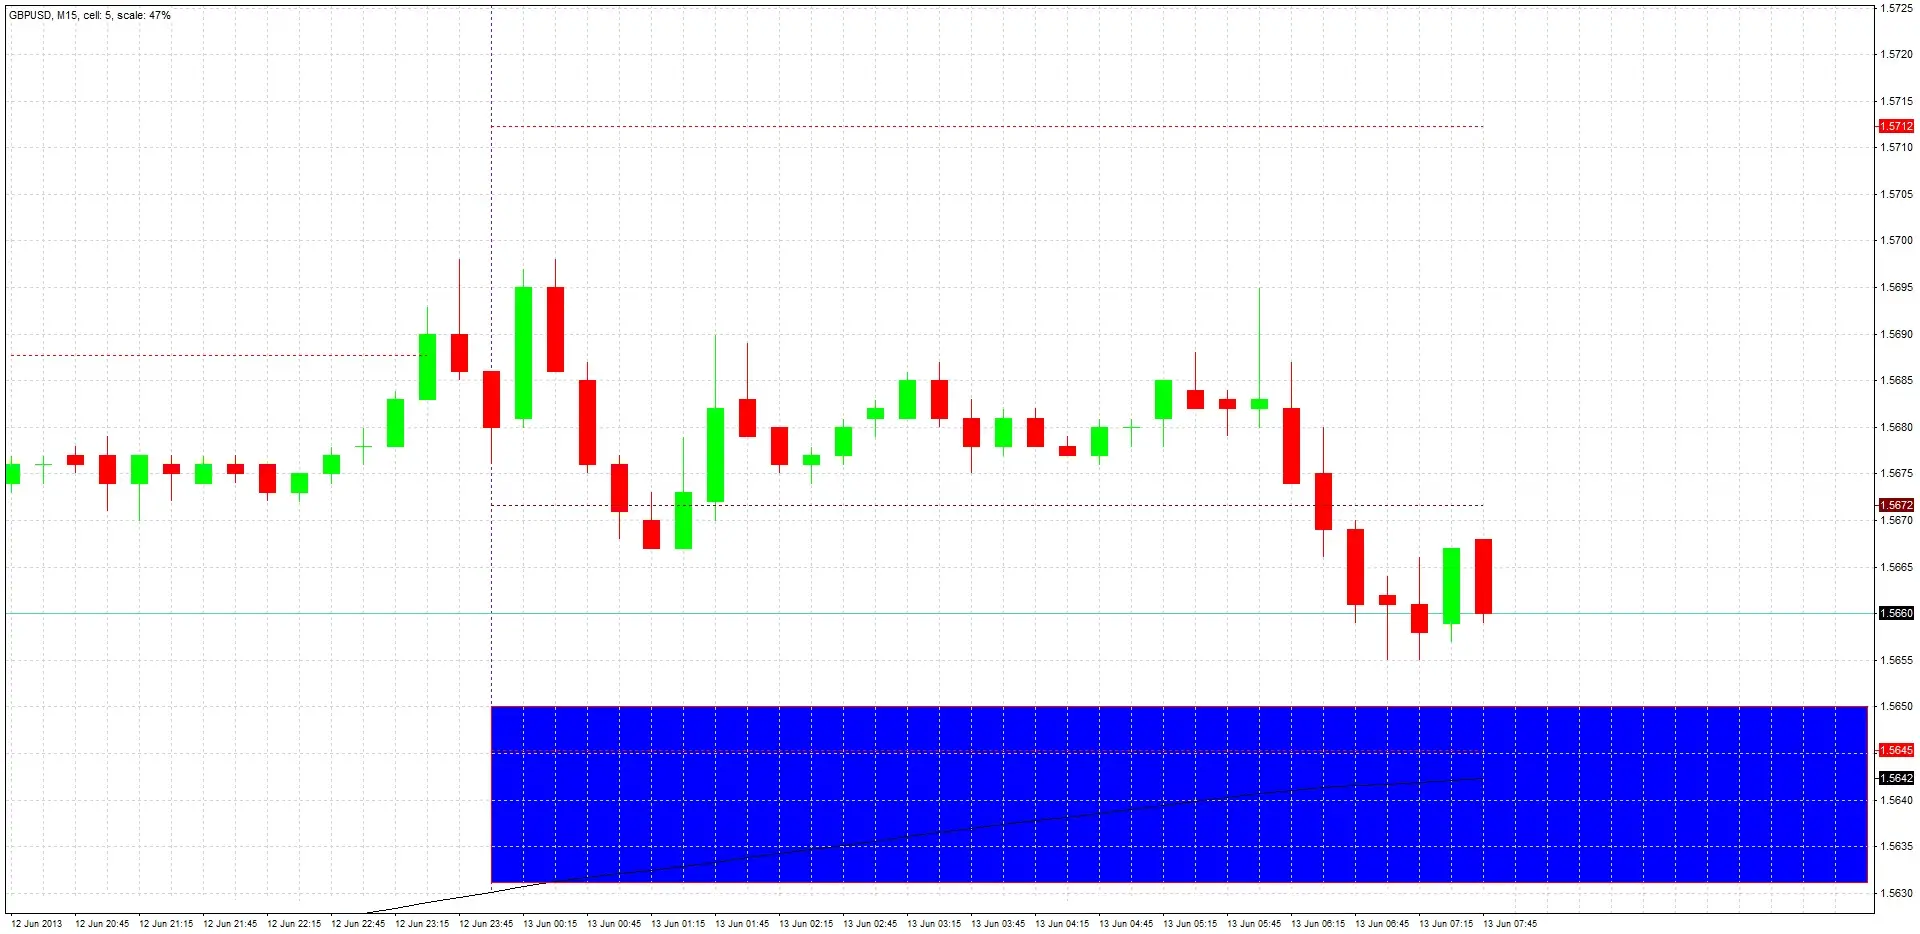
When London opens at 08:00, we drop down to the 15 minute chart to try to find a precise, low pips risk entry. The price has not yet fallen to 1.5650, so we wait and watch for the price to enter the demand zone highlighted in blue. In this strategy, the demand zone is defined as the area between yesterday’s low and the high of the day before yesterday.
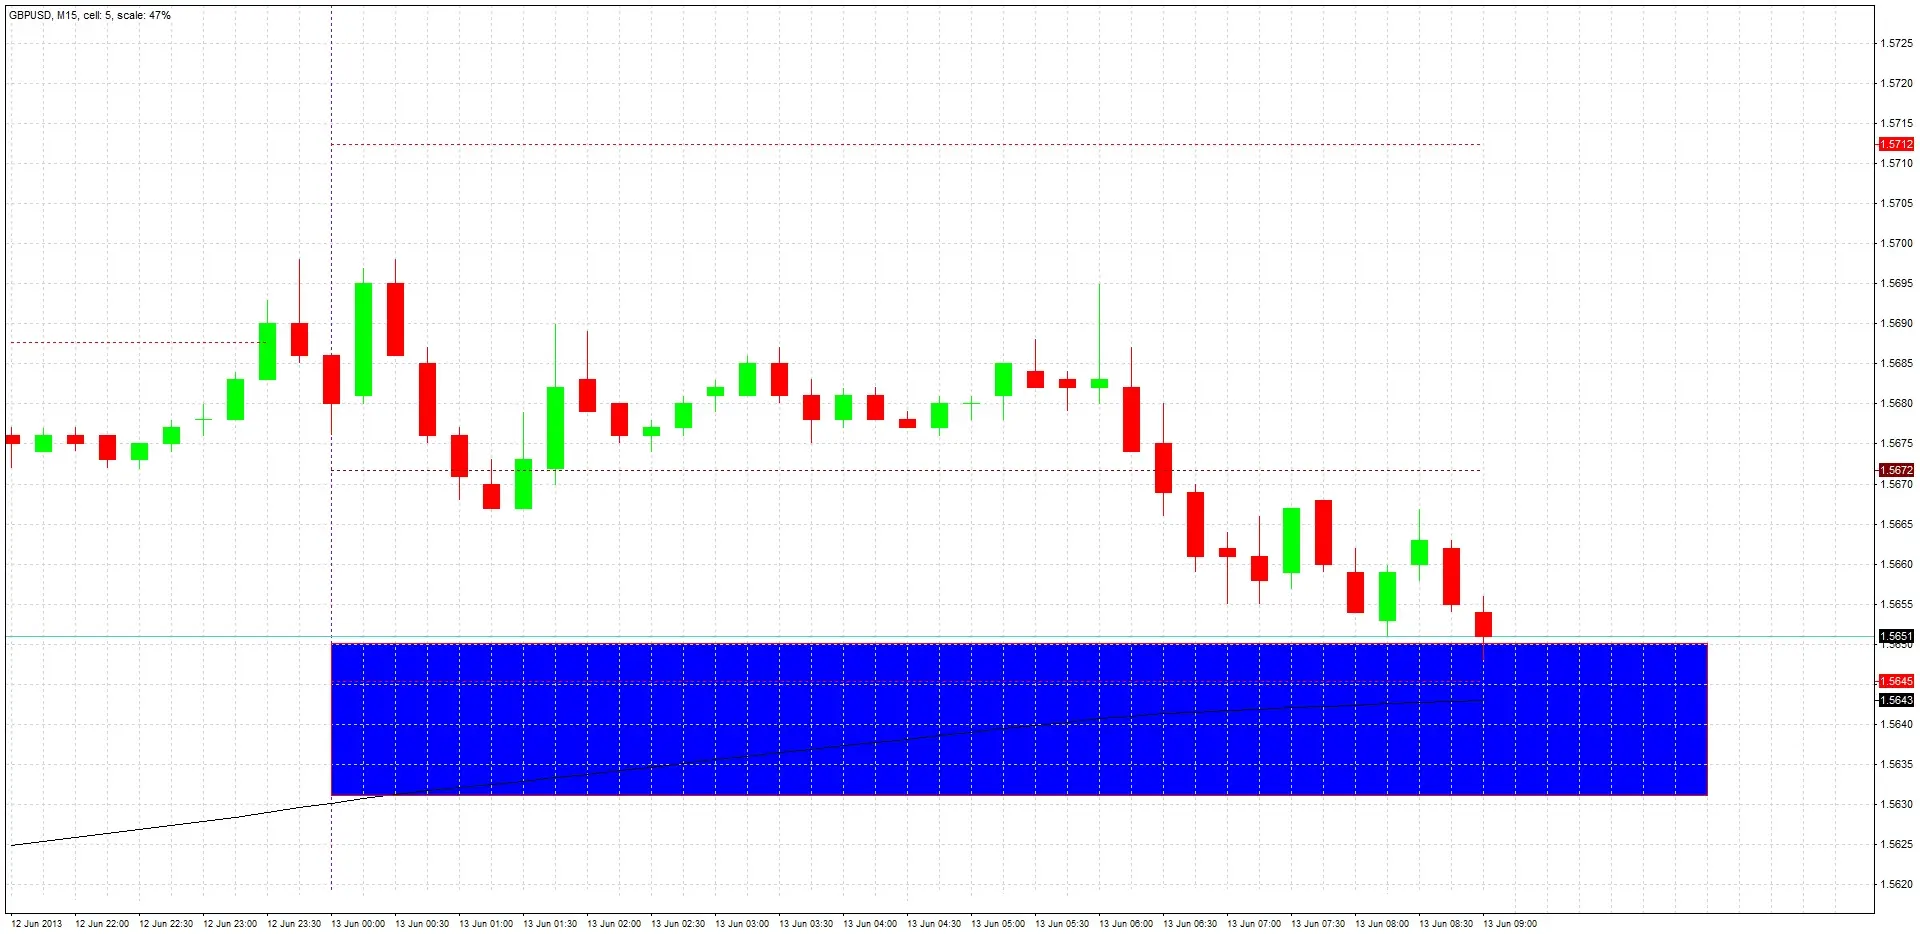
In the Zone
The price drops below 1.5650, entering the demand zone. We are preparing to enter after the close of any signal candle that forms before the low of the demand zone at 1.5631 is broken. The candle that has just closed is nothing special, so we continue to wait and watch.
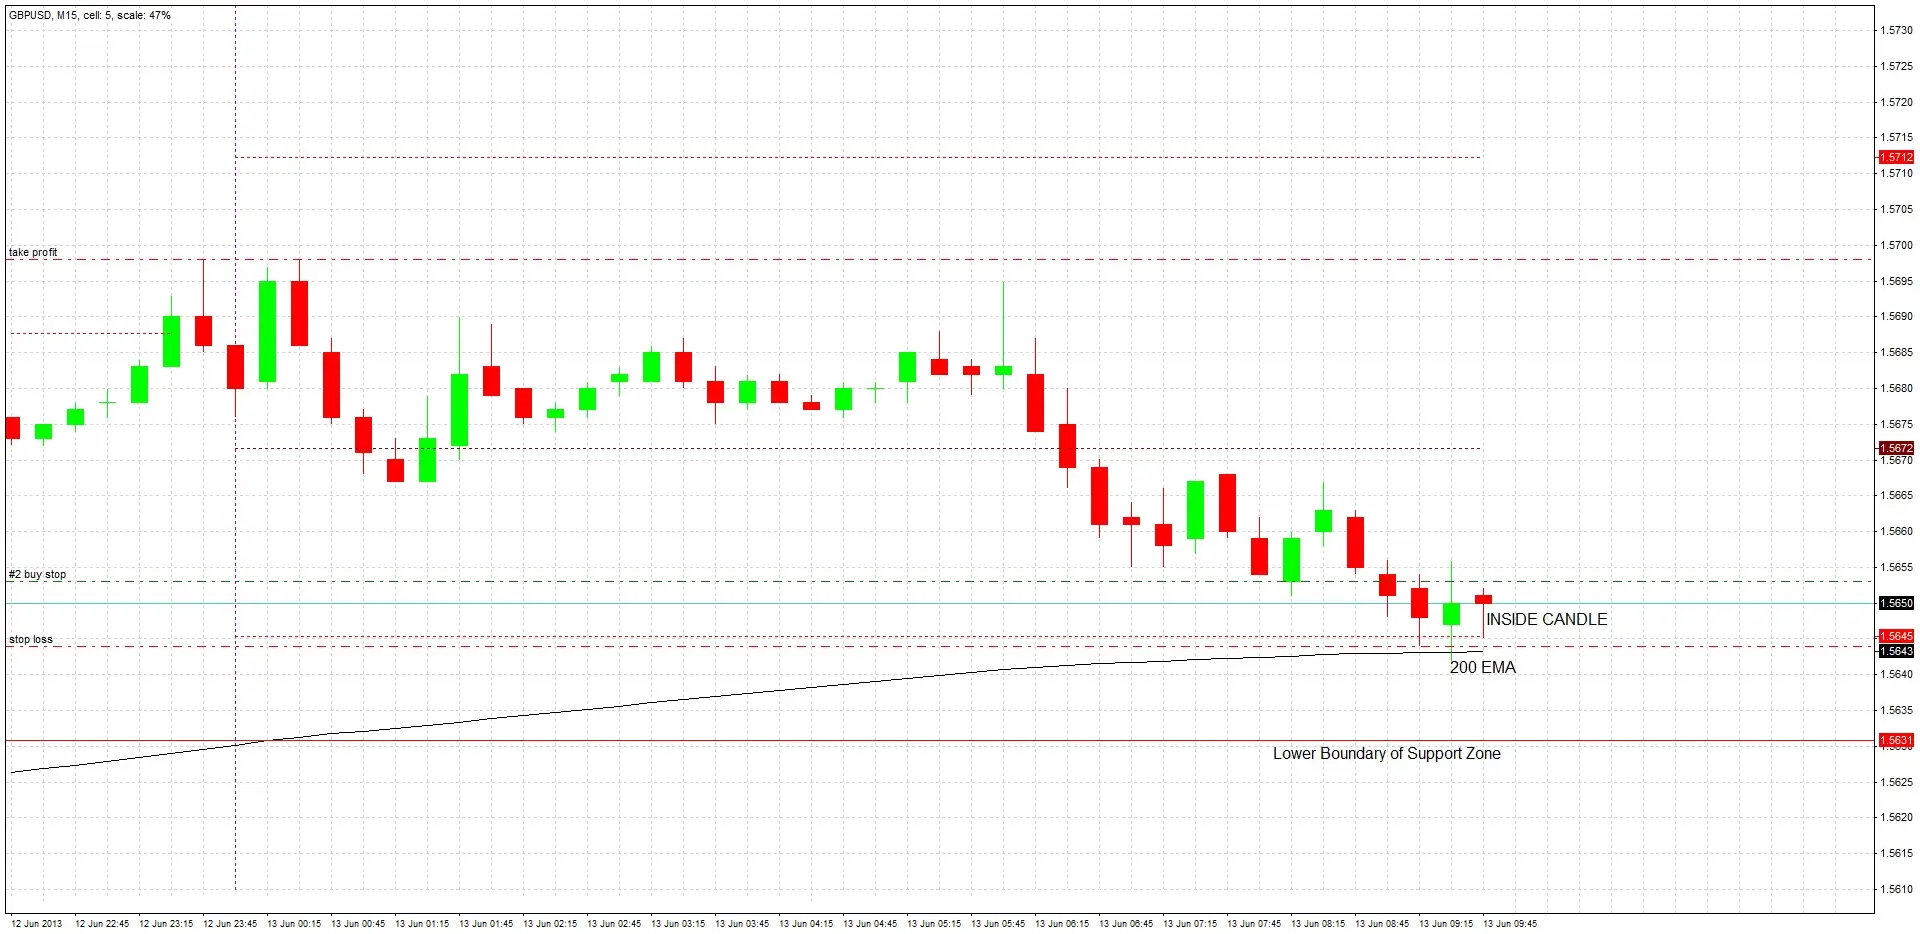
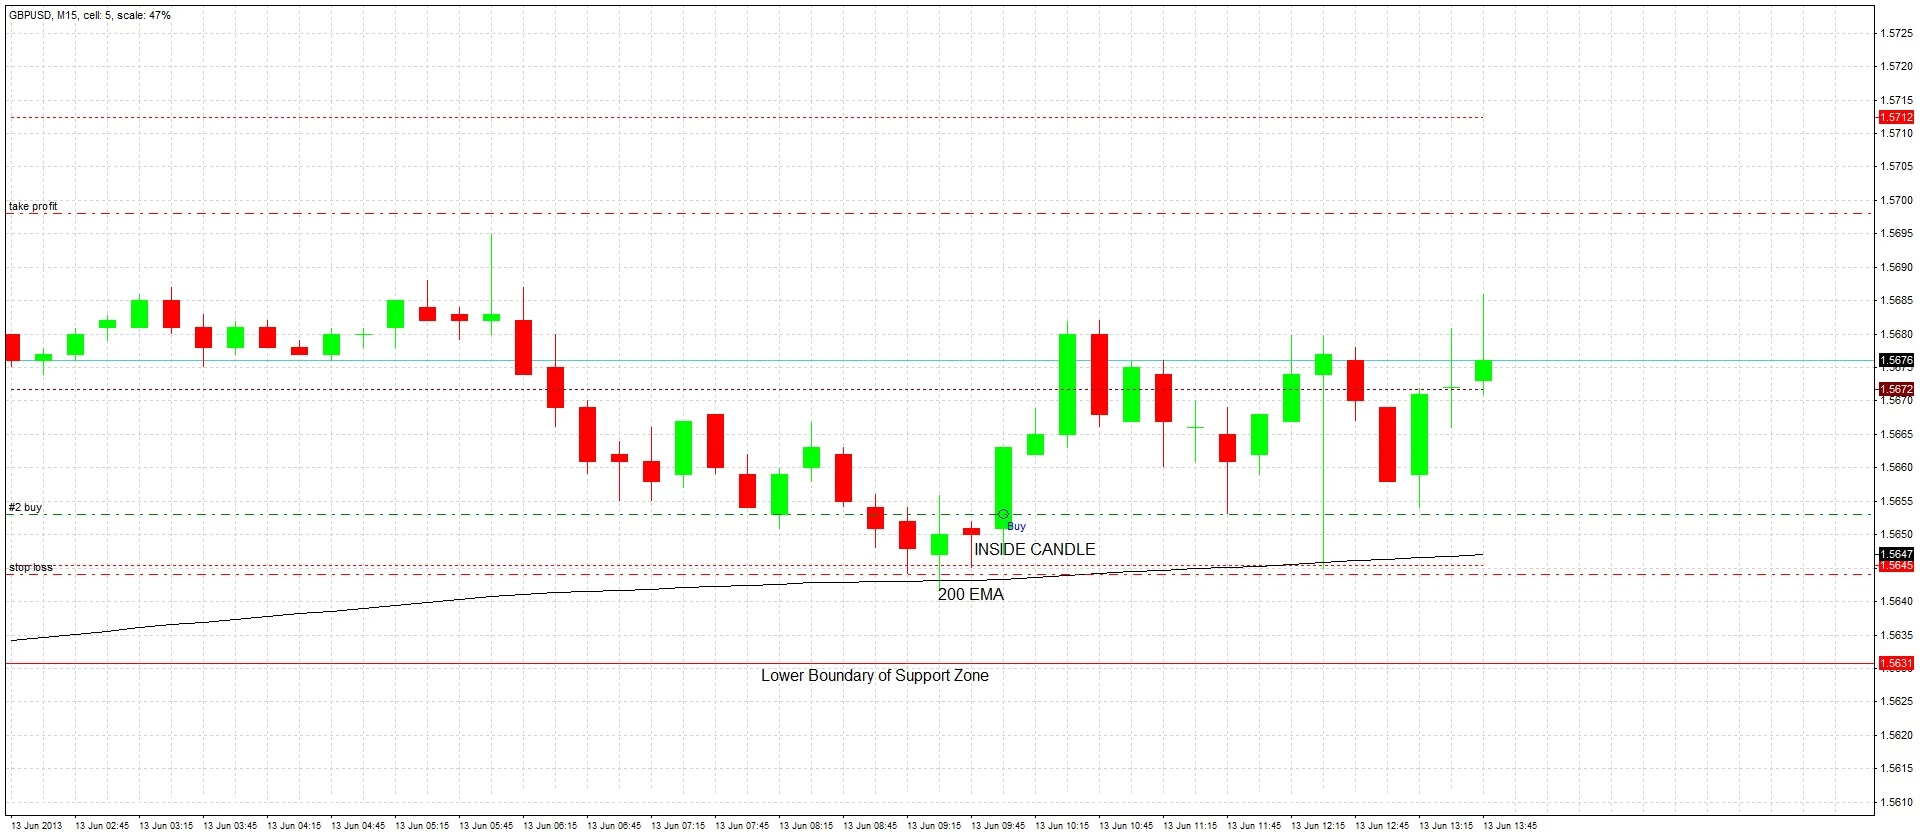
Signal Candle Forms
At 11:00, our first signal candle closes. It is an inside candle. We place a buy stop order one pip above the high of the signal candle, at 1.5653, with our stop loss one pip below the low of that candle, at 1.5644. This is a total risk of 9 pips. We will cancel the order if it is not triggered during the next 15 minute candle, as we want to see momentum, or if the low of the signal candle is broken before the high, as we want to see this level holding as support. Our first profit target should be the highest price of today or yesterday i.e. fairly major S/R, which is at 1.5698. This is a profit target of 46 pips minus the spread, giving us a healthy reward to risk ratio of about 5:1. Encouraging signs are that we have just had an upward bounce off the 200 EMA, which often acts as mobile support within a trend, and both the round number of 1.5650 and the S1 daily pivot point are beneath us and might act as support.
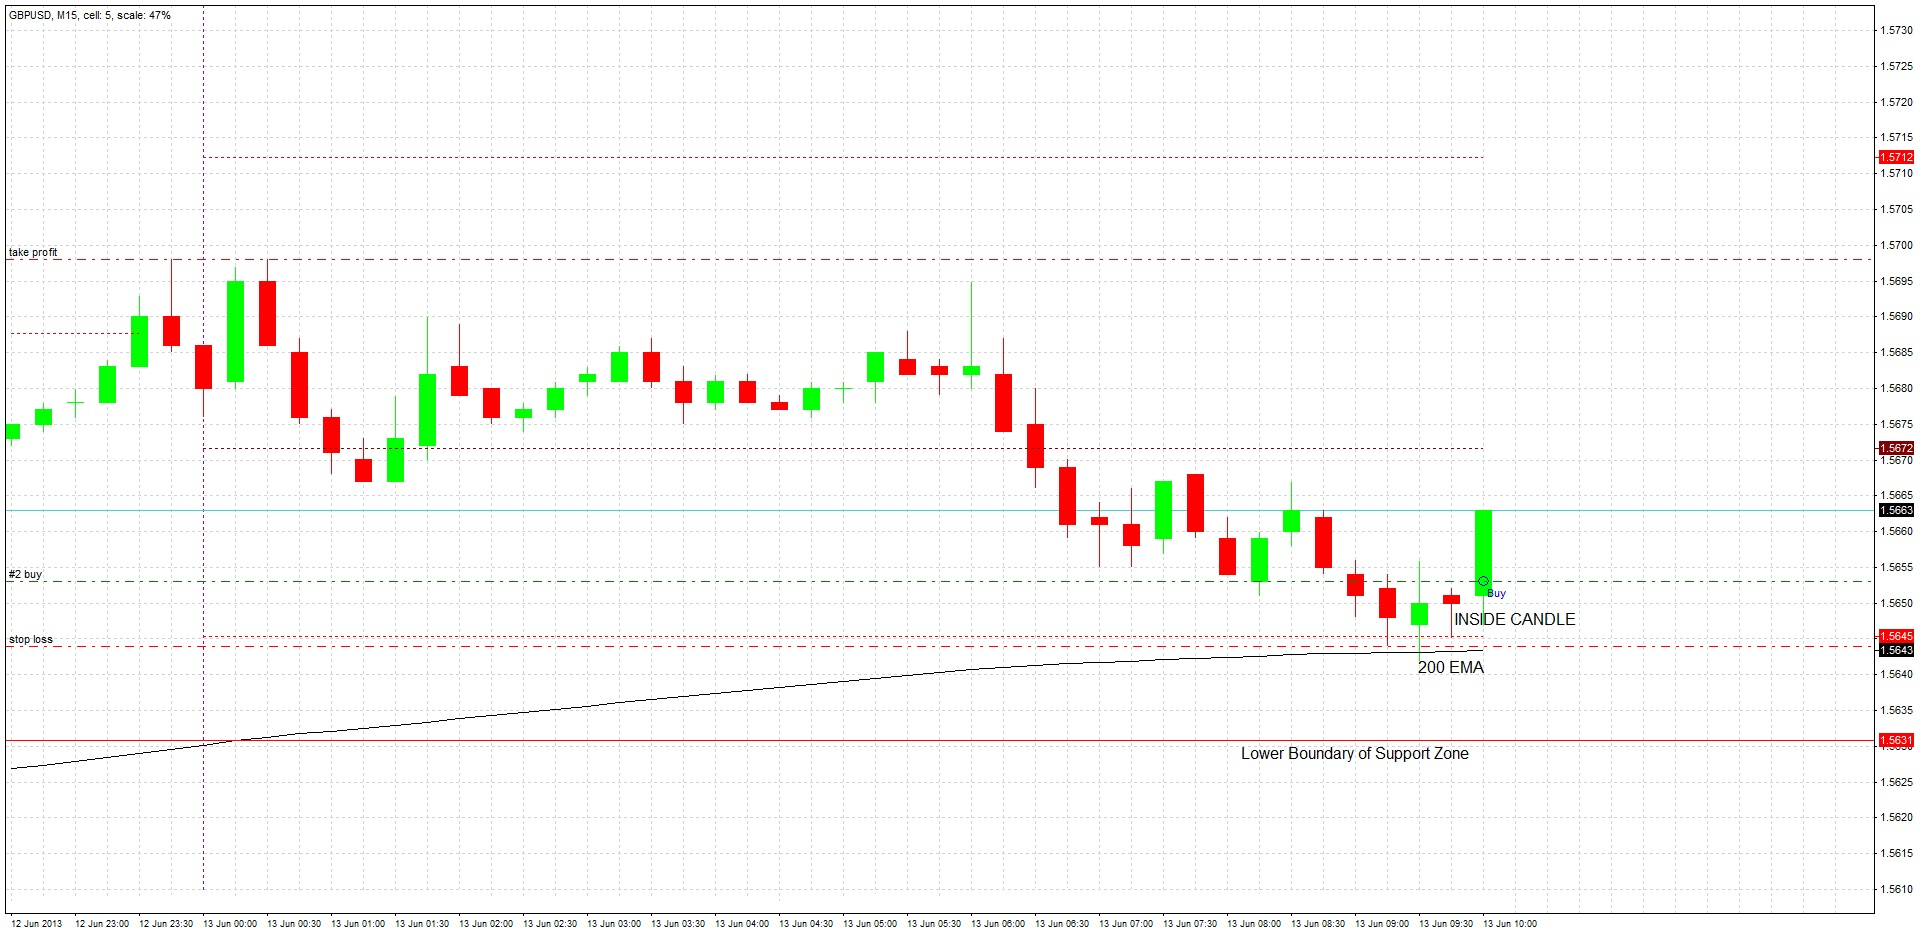
Entry
Our buy order is triggered during the next 15 minute candle.
Positive USD NewsT
Three items of high-impact US economic data are released simultaneously: Core Retail Sales, Retail Sales, and Unemployment Claims. Each item positively exceeds the market’s expectations, which we expect to strengthen the USD against the direction of our trade. We still sit tight and wait to see how the trade develops.
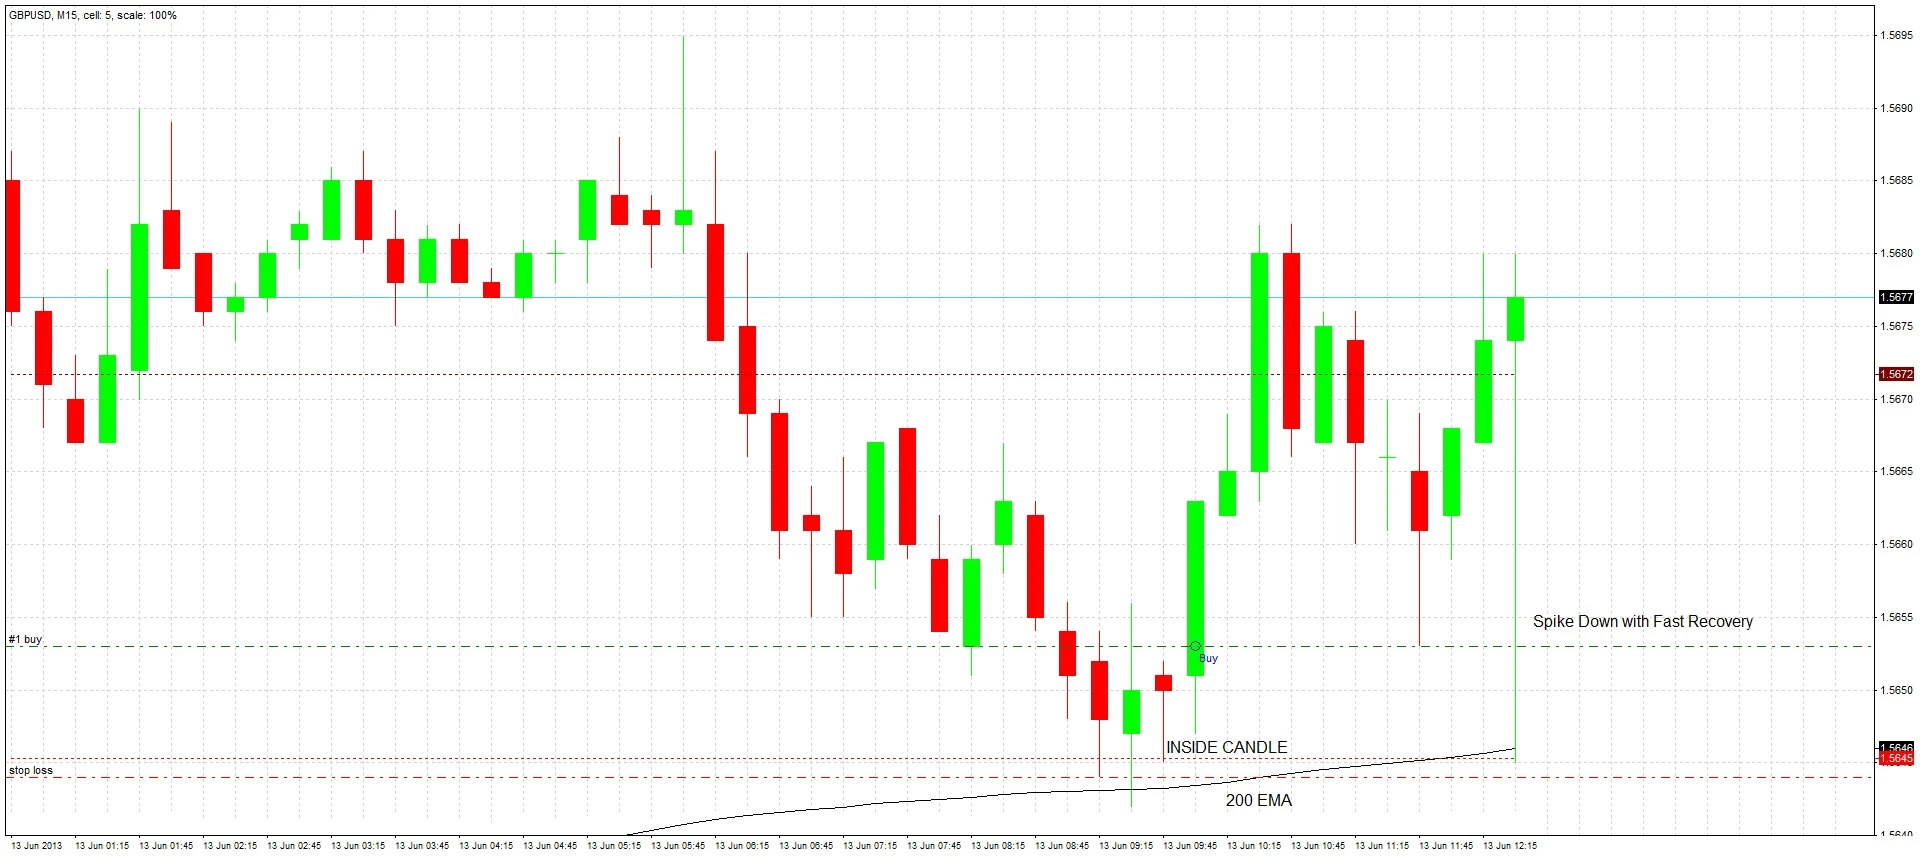
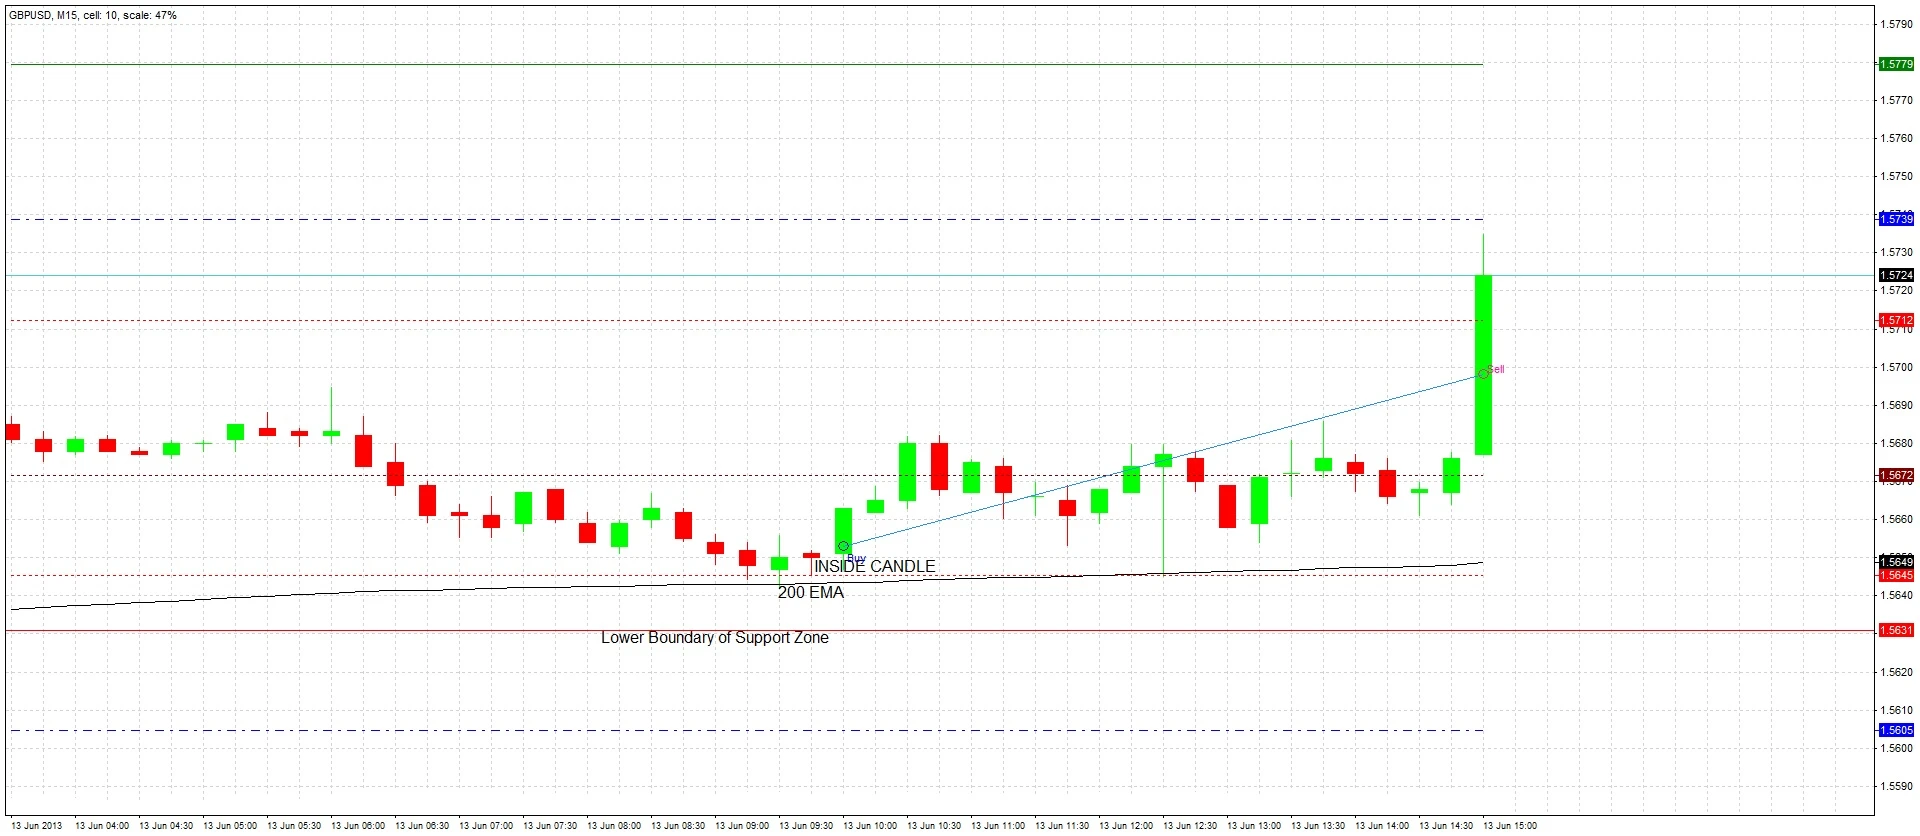
News Impact
The news releases negatively impacted our trade, spiking the price down to within one pip of our stop loss at 1.5644, however the price bounced right back up again. The fact that our tight stop loss survived this event is a bullish sign for our trade. Note how the 200 EMA and S1 pivot point acted as support again. We continue to watch and wait and hope for the best.
Trade Management
Almost four hours have passed since we entered this trade. We are now two hours past the New York session open. Our trade is in profit (+23 pips), but we can see from the price action that over the last 3.5 hours, the price has had difficulty breaking through the 1.5680 level. We should consider our options for managing the trade.

Option 1: Do Nothing
Either our profit target (+5 units of risk) or our stop loss (-1 unit of risk) will be hit.
Option 2: Exit Immediately
The trade is in a reasonable profit of 23 pips. If we exit now we will make +2.5 units of risk, which is a healthy reward to risk ratio.

Option 3: Move Stop Loss to Break Even
Either our profit target (+5 units of risk) or our stop loss (-1 units of risk) will be hit.

Option 4: Take Partial Profit
We could sell 29% of our position and hold the remaining 71%. Either our profit target (+4.37 units of risk) or our stop loss (0 units of risk) will be hit.
Conclusion
It turned out that Option 1, doing nothing, would have been the best of the 4 options, as our original profit target would have been hit before our stop loss, giving a winning trade of +5 units of risk. Remember that the most profitable option for one particular trade may not work out the best over a number of trades. Traders have to accept some losses and follow some kind of plan. Some traders make it a rule to never manage a trade once they have entered it, others have a rule to allow themselves some discretion. Less experienced traders are likely to do better if they do not manage trades at all, but stick instead to original stop losses and profit targets.
