Market Snapshot Example 3
Picking Pairs & Strategies: Market Snapshot Example 3
Based on actual trading data from August 24, 2014. Using a variety of technical and fundamental analytical tools, we examine a range of major and minor currency pairs over the weekend, determining from a review of technical charts and forthcoming economic events where likely trade decision points are going to arise. Noting these points, our ongoing analysis determines which strategy should be best used in each particular case to take advantage of any trade opportunity.

Market Snapshot Example 3
Subjects Covered:
- Signal Candles
- Time of Day
- Position of Support/Resistance
- News Impact
Weekend Review 1
I believe that a trading strategy is a weapon for a trader in the forex market. You must have one. Otherwise, it will be like challenging well-armed Forex robbers with a pea-shooter. The Forex market -like any other market – works in a very simple way. It accumulates in a certain area for a while and once the accumulation process is over, it advances to a certain distance until the distribution starts.
This week, we have another 4 pairs to analyze. We are going to inspect each of them in turn, and review our options.

Weekend Review 2
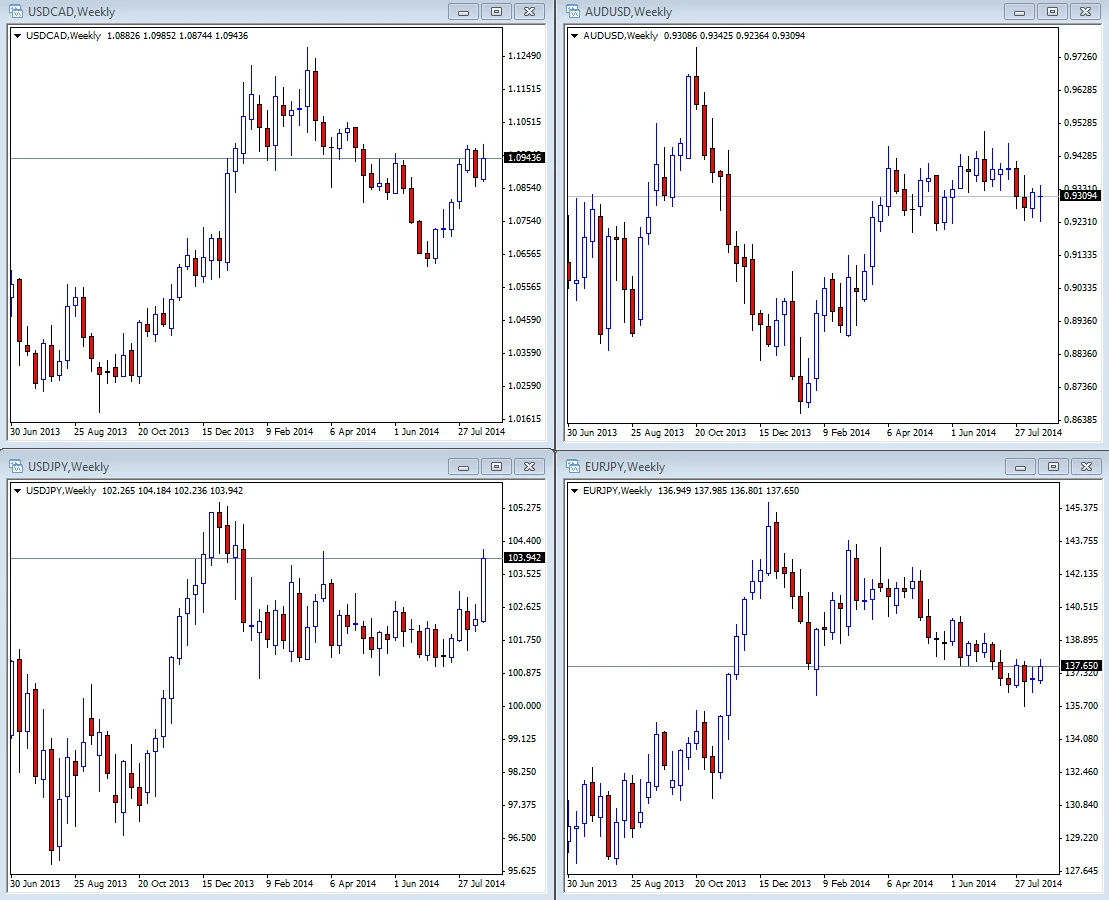
Here are technical studies that I added to the charts, after a short observation.

Weekly News Calendar
The next thing I do is to check the weekly economic calendar and find out if there are any high impact report releases which might affect the pairs I picked. Next let’s inspect the charts closely.

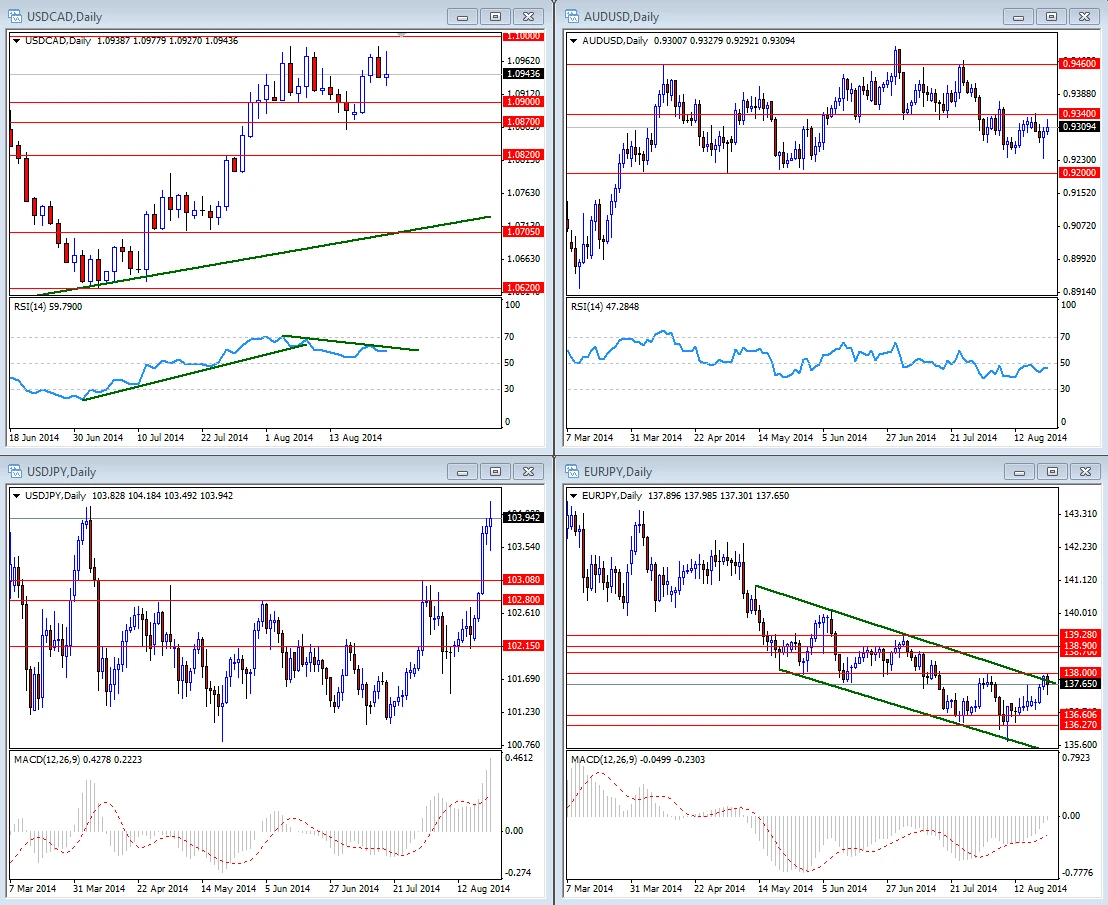
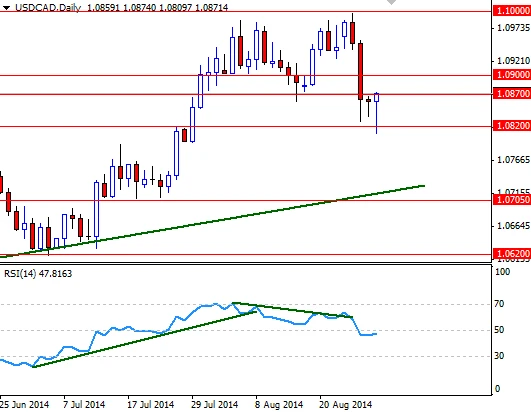
USD/CAD
The reason I switched to a daily chart is to show that you can apply trend-lines on indicators such as RSI. This can be very helpful, especially when the chart is too ugly to draw on it. Price-indicator divergences are something to pay attention to as well, especially when the pair is trying to break through a tough resistance area. I am bullish on USD/CAD -simply due to the fact that the ascending trend-line has been holding this pair up since 2012- but that doesn’t mean that I expect prices to move in a straight line.
Options:
– Open a short position…The pair is going to retreat to 1.0820 (or it won’t stop till touching the trend-line).
– Open a short position at 1.1000; with a stop-loss at 1.1040, targeting 1.0820 (do you think my stop and profit levels are correct?)
– Go long above 1.10 or wait for a pullback.
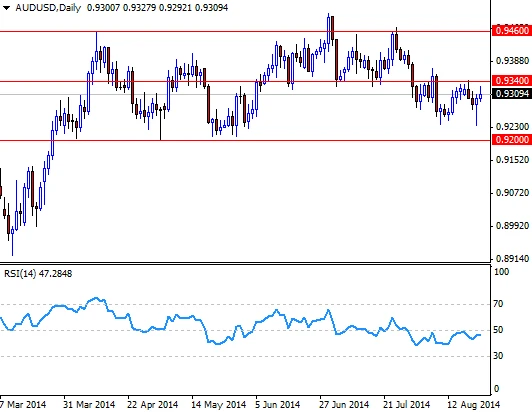
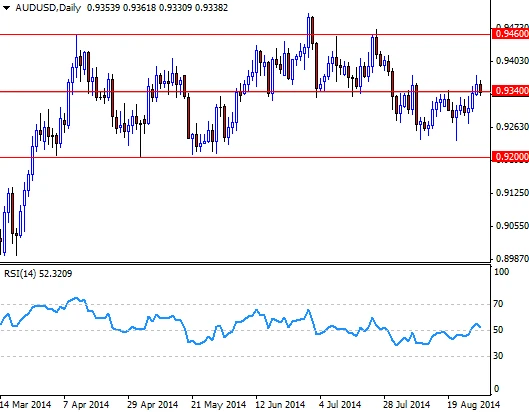
AUD/USD
Since mid-March the AUD/USD pair has been range-bound. As you can see on the daily chart, the bears increase pressure when prices approach the 0.94 level. Similarly, the bulls step in around the 0.92 level. Such situations may provide trading opportunities for some traders, of course. Personally, I try to avoid trading (in the opposite direction) if the market has a specific bias for either of the currencies in this pair (USD in our case).
Options:
– Open a short position at 0.9340.
– Open a long position if the pair pulls back to the 0.9230/00 area.
– Go long targeting 0.9395.
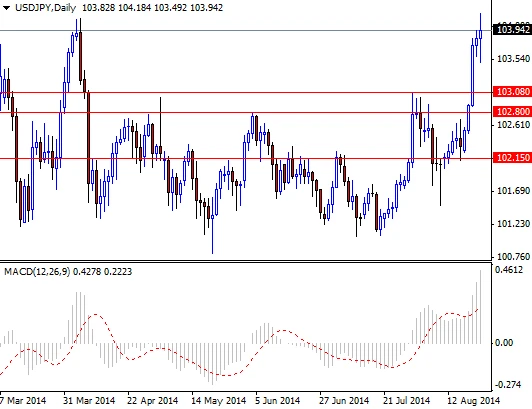
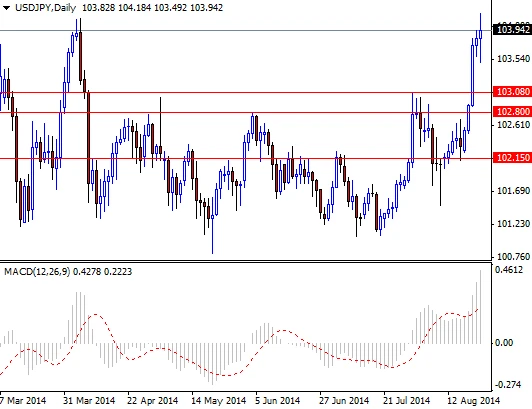
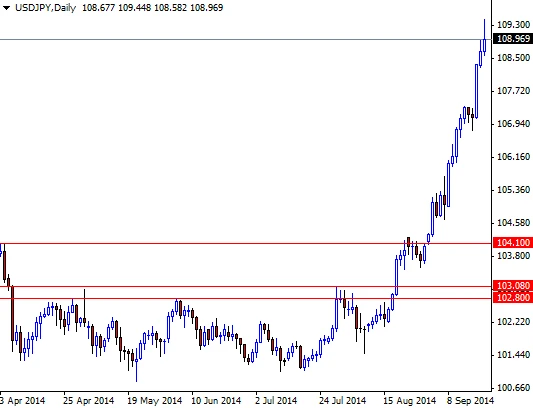
USD/JPY
Increasing demand for the USD pushed this pair significantly higher last week. Breaking above the 103.08 resistance lured more buyers into the market and as a result the pair traded as high as 104.18. The resistance around the 104.10 level will probably play a crucial role because prices reversed around this same area in the past.
Options:
– Go long targeting the 105 level…I don’t care how parabolic it looks!
– Go short if the pair can’t close above 104.10.
– Wait for a pullback towards 103.08 and open a long position.

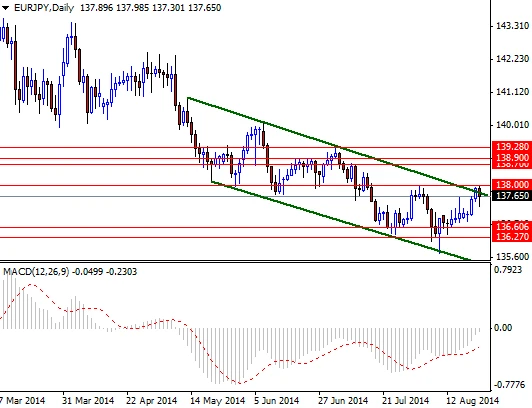
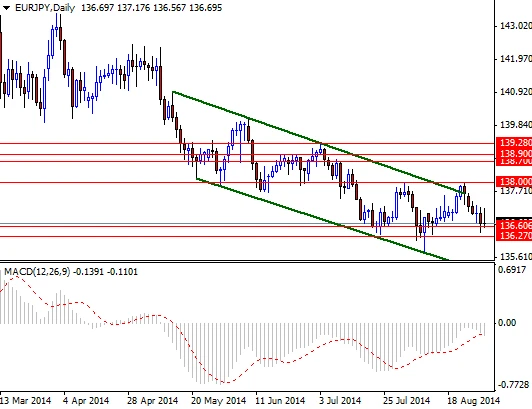
EUR/JPY
Unlike the USD/JPY pair, the EUR/JPY has been trading in a descending channel for some time. It appears that the pair is suffering directly from the weakness in the EUR and because of this we can’t see any real momentum. I think anchoring somewhere above the 138.00 resistance level is essential if the bulls intend to charge towards the 138.70/90 zone.
Options:
– Go long if the pair breaks through 138.00 targeting 138.70.
– Go short if the pair hits 138.70.
– Go short targeting the bottom of the channel!
Past Week Review
Last week, we picked 4 new currency pairs and applied some technical analysis methods to decide what to do (deciding what not to do is as important as what to do, if you want to be a successful trader). Today, we are going to see the results.

USD/CAD 2
I think this pair demonstrated a good example why we should pay attention price-indicator divergences.
USD/CAD 3
The pair tried to break through the 1.1000 resistance on Tuesday but the bulls’ failure triggered profit taking and eventually we retreated back to the 1.0820 level. It looks like our best option was going short around 1.1000 targeting 1.0820. However, setting stop-loss to 1.1055 (instead of 1.1040) would be safer. By the way, note the hammer that formed on Friday after the market hit 1.0820.
AUD/USD 2
Last week, there were two things to pay attention (though I didn’t mention on purpose). First, we had a similar price-RSI divergence. Second, there was hammer formed on Thursday. If you noticed these two, you would eliminate options regarding going short. Next, let’s check what happened.
AUD/USD 3
It looks like our best option was going long targeting 0.9395. If you went long, by now, it would be safe to adjust your stop-loss to the entry point.

USD/JPY 2
USD/JPY pair had a very strong week earlier and we were wondering if the bulls could maintain this momentum. Next let’s check what happened:
USD/JPY 3
Breaking above the 103.08 level was an important event for this pair because the market was trapped between 103 and 101 for a long time. We had expected that if the market had a daily close above the 104.10 level, then the 105 level would be tested next (103 – 101 = 200 pips so 103 + 200 pips = 105).
The USD/JPY pair performed well beyond our expectations and hit its highest level since August 2008. This is a good example of why trying to find tops or bottoms doesn’t work (you might apply this to recent action in the GBP/USD pair as well). Keep in mind that the market can be overbought (or oversold) for a pretty long period of time.
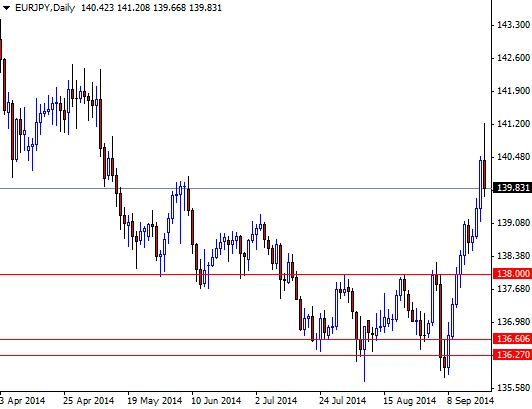
EUR/JPY 2
Last week, we underlined that unlike the USD/JPY pair, the EUR/JPY has been trading in a descending channel for some time. We also said the 138.00 resistance level was the key to the upside. Did the pair end the week higher?
EUR/JPY 3
Not surprisingly, the pair remained within the descending channel. If you were thinking of longing the Japanese yen, EUR/JPY would have been a better choice. On the other hand, directly targetnig the bottom of the channel was too optimistic. Depending on the technical outlook, you may want to consider partial profit takings.

AUD/USD 4
The AUD/USD pair was stuck roughly between 0.9460 and 0.9200. We said that while this situation could provide trading opportunities in both ways, it was better to avoid trading against the bullish USD.
Not surprisingly, the pair accelerated its descent right after the 0.9200 floor collapsed. If you measured this consolidation area (0.9460-0.9200 = 260 pips) which was broken, you could have reached a very reasonable target of 0.8940.
USD/JPY 4
Breaking above the 103.08 level was an important event for this pair because the market was trapped between 103 and 101 for a long time. We had expected that if the market had a daily close above the 104.10 level, then the 105 level would be tested next (103 – 101 = 200 pips so 103 + 200 pips = 105).
The USD/JPY pair performed well beyond our expectations and hit its highest level since August 2008. This is a good example of why trying to find tops or bottoms doesn’t work (you might apply this to recent action in the GBP/USD pair as well). Keep in mind that the market can be overbought (or oversold) for a pretty long period of time.
EUR/JPY 4
A couple of weeks ago, we had compared the EUR/JPY pair with the USD/JPY pair. The EUR/JPY pair was suffering directly from the weakness in the JPY and as a result we didn’t see a compelling case to go long. We noted that achieving an anchoring somewhere above the 138.00 resistance level would be essential if the bulls intended to charge towards the 138.70/90 zone.
Closing above the 138.00 resistance level lured more buyers to the market -as expected – but of course prices didn’t reach multi-year highs. That is why the relative strength of a currency does matter. Since we can’t carry too many positions, we have to be able to identify the pairs representing better opportunities.
