GBP/USD Trade
Bollinger Bands Strategy Simulations: GBP/USD Trade
Based on actual trading data from Jan 26, 2012. Using the DBBs strategy on a major currency pair, we monitor multiple time frames to select a pin point entry. The DBB signals, strength of the trend, and position of support and resistance are considered before entering at a time of day that is appropriate to this pair. The trade runs into difficulty very quickly, so the concepts of what constitutes a bad sign for a trade, and ways in which a trade can be managed according to changing circumstances, are considered.

GBP/USD Trade
Subjects Covered:
- Bollinger Band Momentum
- Multiple Time Frame Coordination
- Signal Candles
- Time of Day
- Position of Support/Resistance
- Pivot Points
- Whole Number
Signal 1
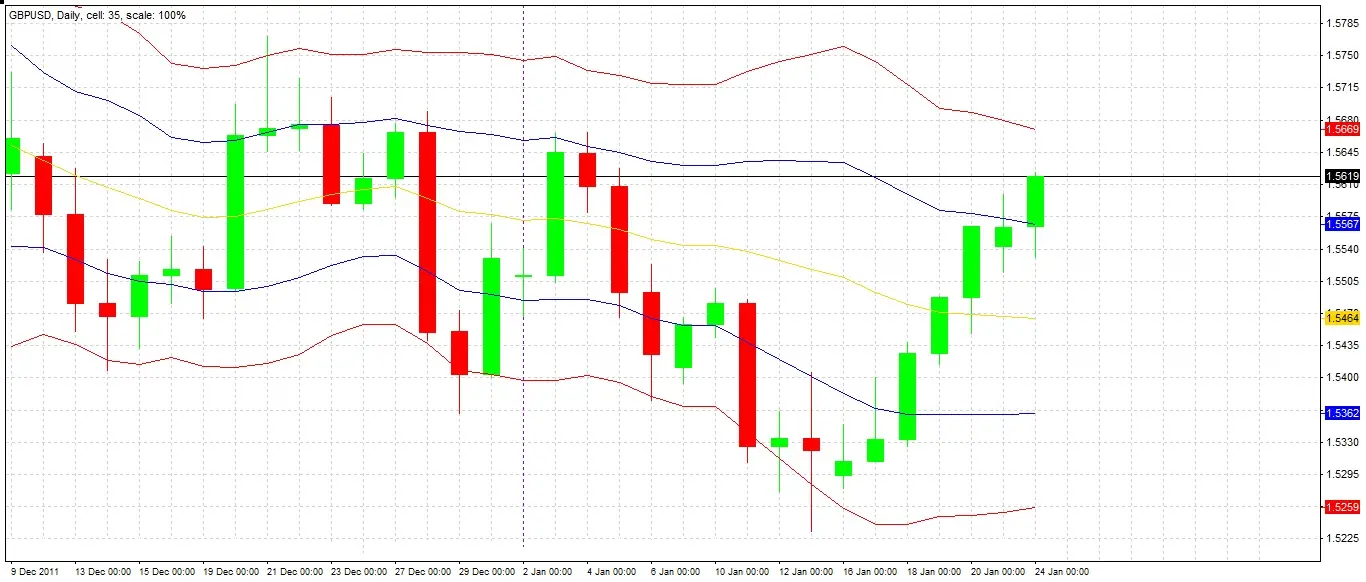
DBBs applied to the daily chart shows a change of status, with a first candle closing in the buy zone. This is a signal to look and see whether there are any other indications also supporting opening a long trade.
Signal 2
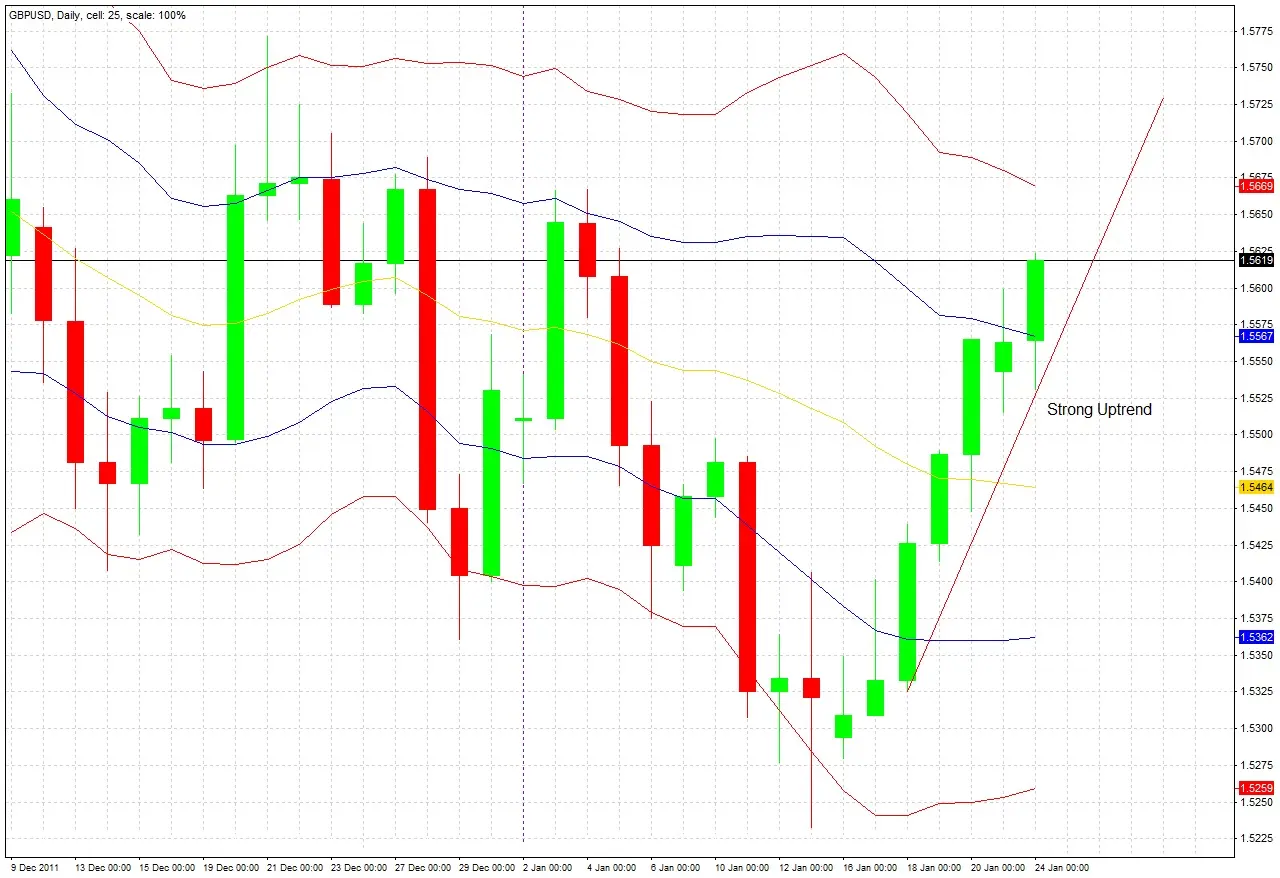
The daily candles are in a very strong bullish uptrend, with the last 7 consecutive days closing up. This is another indication that it is a good time to go long. We should ask ourselves next, are there any reasons for caution?
Caution!
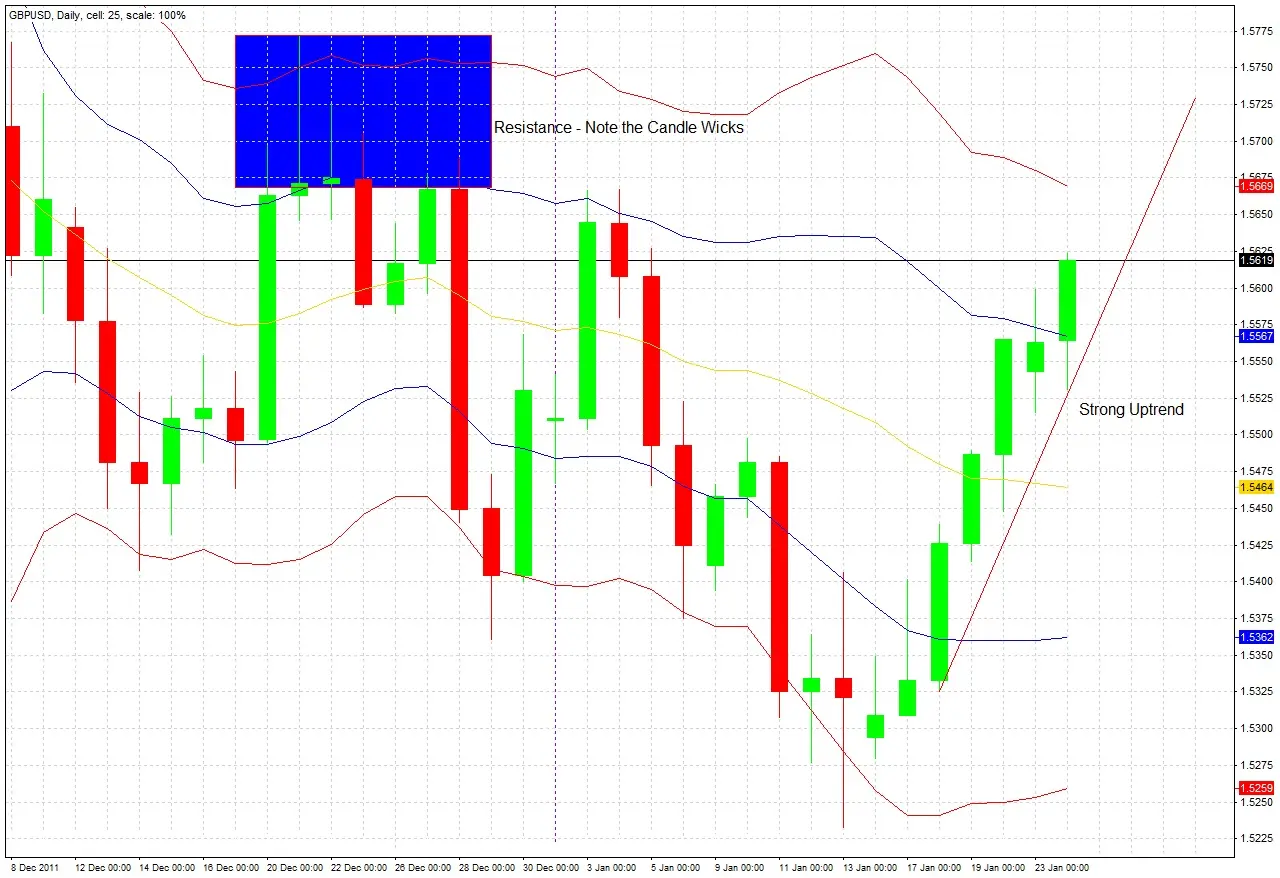
Looking at the daily chart, we can see that we are approaching a zone of potential overhead resistance. We can see this from the wicks of the candles that rejected this price level when the price was last here. So we need to be careful. To minimise risk, we can drop down to a lower time frame to look for a good entry. This is multiple time frame analysis.
Begin Monitoring Lower Time Frame
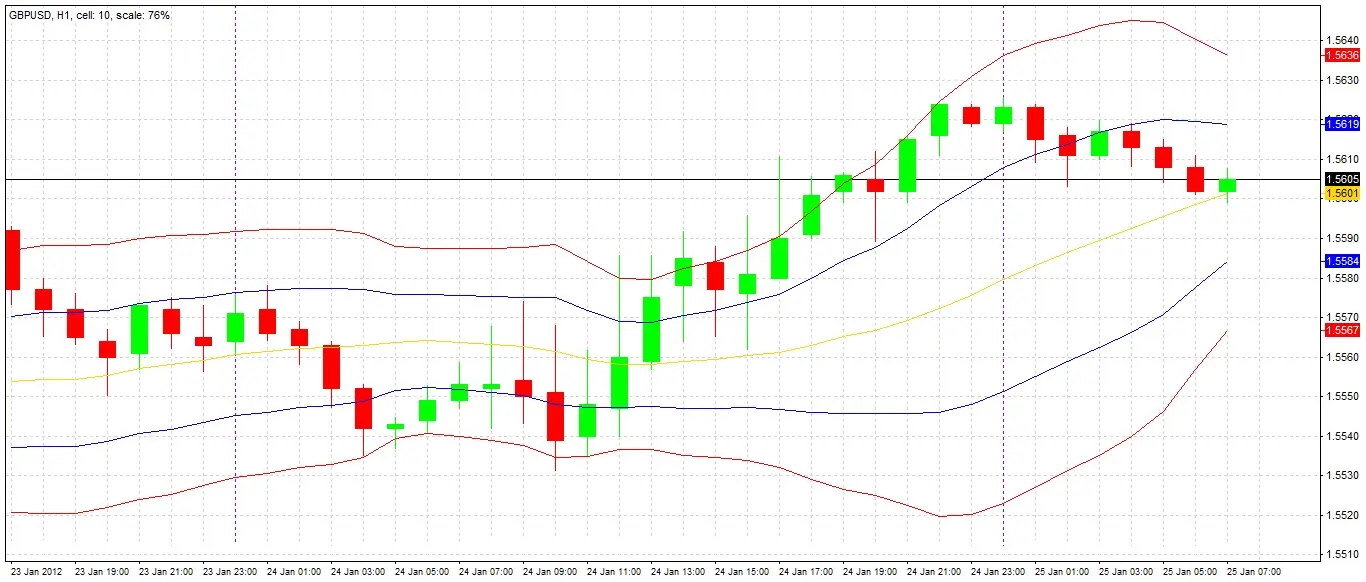
We wait for the London Open tomorrow morning at 08:00, because it is not usually a good idea to trade this pair between the New York Close and the London Open due to low liquidity. DBBs applied to the hourly chart at the London open the following morning show the candles are in the neutral zone, so we cannot consider a trade now. We must watch and wait.
Signal 3
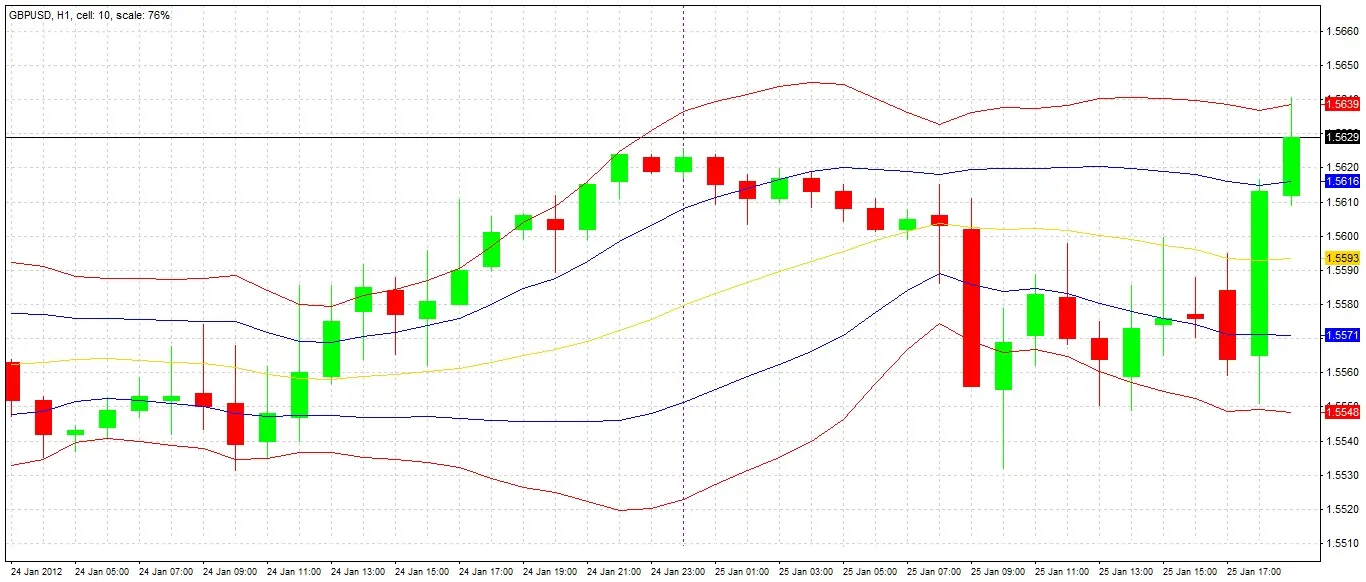
For the first time since the London open this morning, a candle has closed within the buy zone on the hourly chart. However, it is risky to enter a trade at this hour after London has closed for the day at 17:00 GMT. We continue to watch and wait.
Signal 4
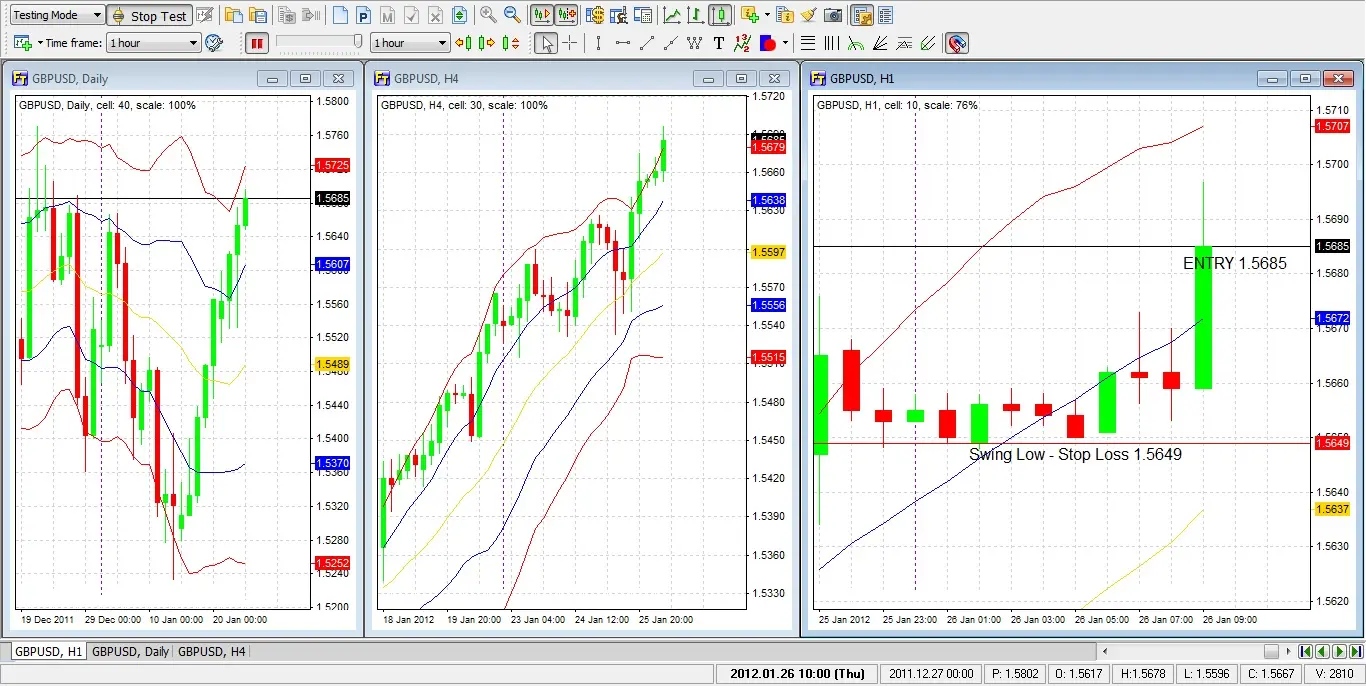
The next day, 2 hours after the London open, a bullish candle closes within the buy zone on the hourly chart on the right. The charts from the left show the daily and 4 hour charts, both of which look very bullish with action firmly in the buy zones, although the daily chart suggests we are in a resistance zone which is concerning. As multiple time zone DBBs, price action and momentum are all on our side, we now have multiple indications to enter a long trade, placing our stop loss under the swing low at 1.5649. We set a target with a reward of 1.5X risk = 54 pips.
Trade Management Decision
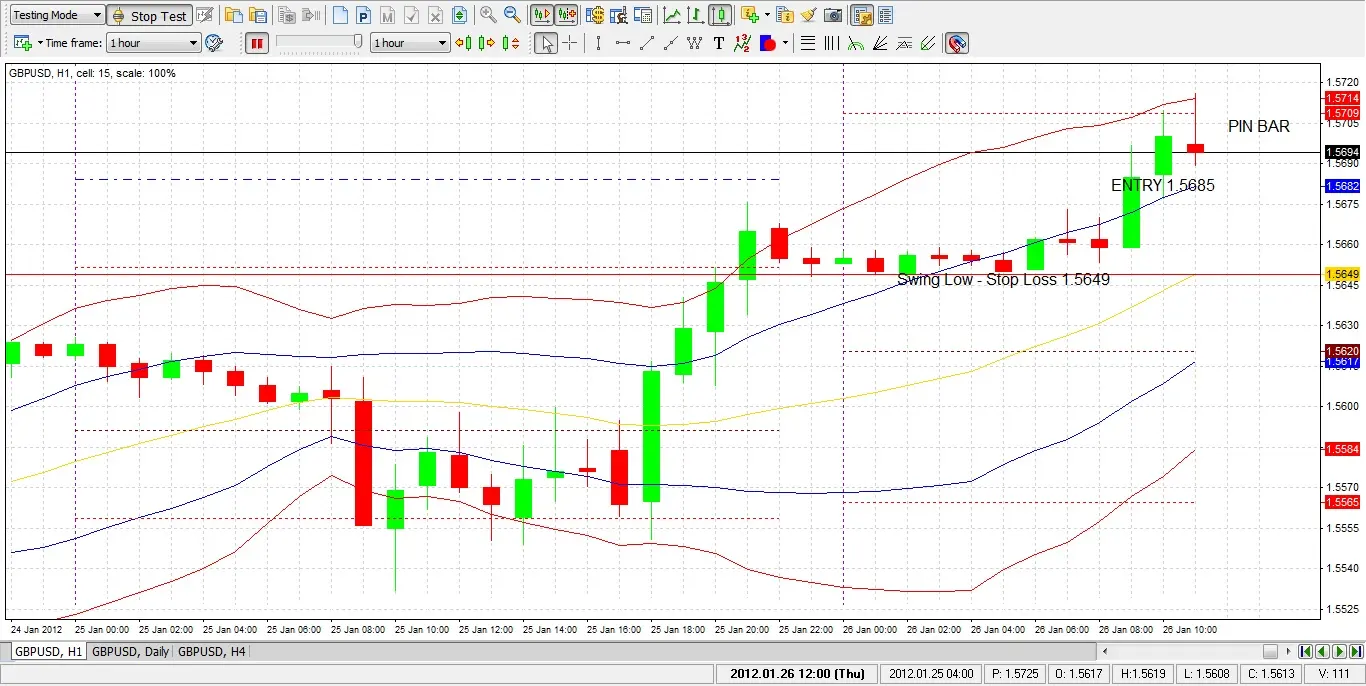
Two hours after entering the trade, a decision has to be made. We see that: 1. The hourly chart prints a bearish pin bar 2. The wick of that bar has been rejected from a whole number (1.5700) 3. It was also rejected from a resistance pivot point. This is a bearish sign so we can no longer be as optimistic about the outcome. and we need to quickly consider whether to manage the trade.

Option 1: Do Nothing
Either our profit target (+1.5 units of risk) or our stop loss (-1 unit of risk) will be hit.
Option 2: Exit Immediately
The trade is in a small floating profit of 9 pips. If we exit immediately, we will profit by +0.25 units of risk on this trade.
Option 3: Move Stop Loss to Break Even
Either our profit target (+1.5 units of risk) or our stop loss (0 units of risk) will be hit.
Option 4: Take Partial Profit
We could sell 80% of our position and hold the remaining 20%. Either our profit target(+0.5 units of risk) or our stop loss (0 units of risk) will be hit.
Option 5: Exit On Return to Neutral Zone
We could keep our stop loss and profit target, but wait to see if we get 3 consecutive candle closes in the neutral zone before either is hit, and exit at that point, ignoring whether the trade is in profit or loss. We do not know what the outcome would be, but we could not make more than +1.5 units of risk, or lose more than 1 unit.
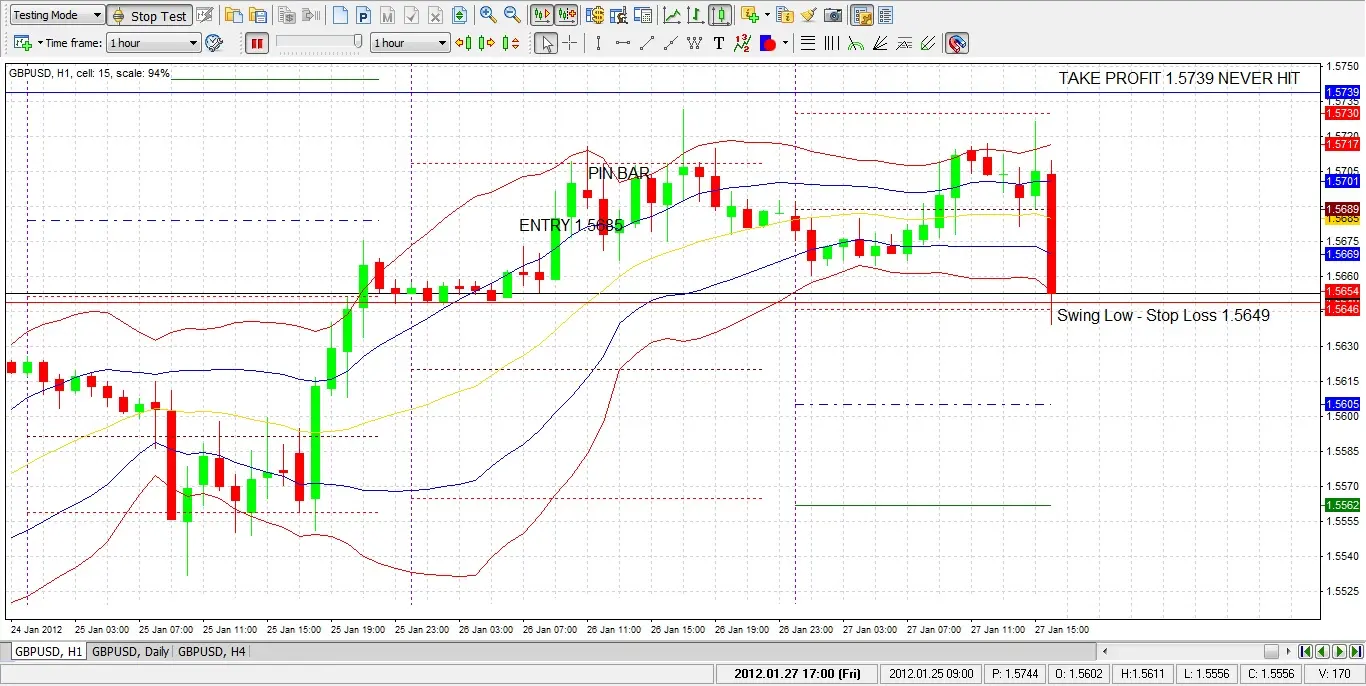
Conclusion
It turned out that Option 2 – exiting the trade immediately – would have been the most profitable of the 5 options. Remember though, that the most profitable option for one particular trade may not be the most consistently profitable option over 100 trades. Traders have to accept some degree of losses and follow some kind of plan. Some traders make it a rule to never manage a trade once they have entered it, others have a rule to allow themselves some discretion. Less experienced traders are more likely to do better if they do not manage trades at all, or only under some very clearly defined rules.
