EUR/JPY Trade Example 1
Multiple Time Frame Momentum Strategy Simulations: EUR/JPY Trade Example 1
Based on actual trading data from June 11, 2013. Using the MTFM strategy on a major JPY cross, we use naked chart analysis to identify a strong S/R zone, and consider dropping down to a lower time frame to try to find a low-risk entry. The MTFM and Signal Candles, volatility of the cross, and position of support and resistance are considered before seeking an entry during the Tokyo session, as is appropriate for a JPY cross. Different entry strategies are considered, and finally compared for their relative profits and losses.

EUR/JPY Trade Example 1
Subjects Covered:
- Multiple Time Frame Momentum Strategy
- 200 EMA
- Multiple Time Frame Coordination
- Signal Candles
- Time of Day
- Position of Support/Resistance
- Average True Range
- Highs and Lows
- Volatility
Signal 1
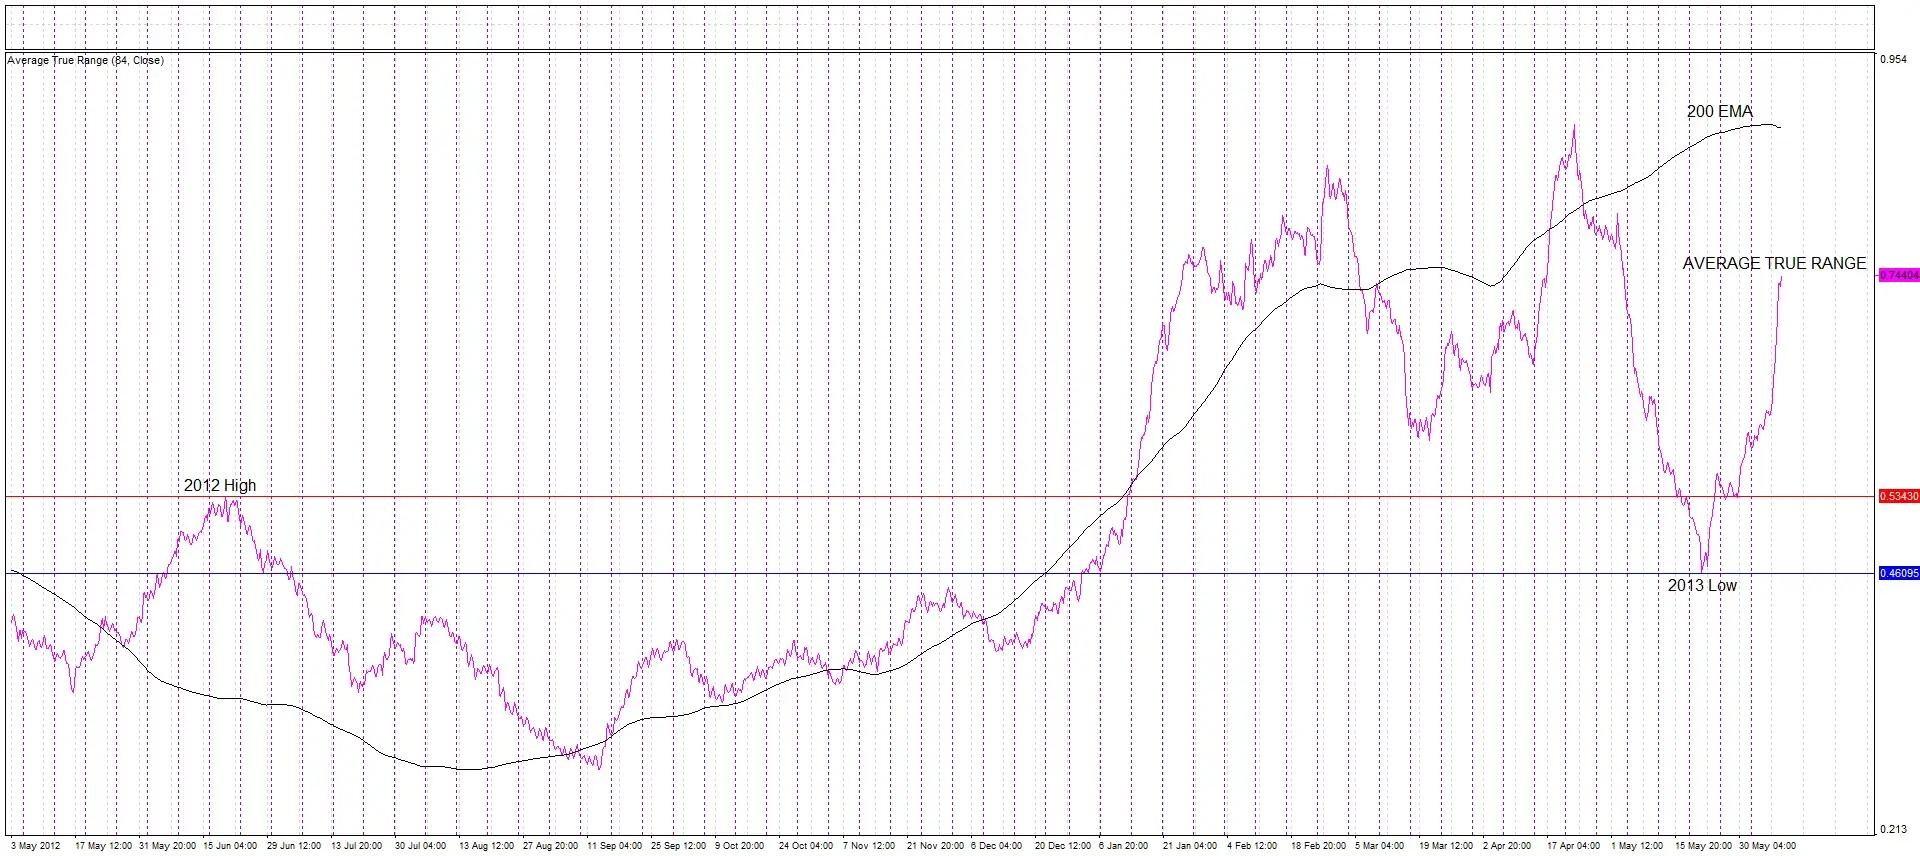
The instrument(s) you trade is/are as important as how you trade. It is much easier to be profitable when you are trading an instrument that moves up and down in value a lot, provided there are entry points where price movements are calmer. This graph plots the average true range of the last 14 days’ 4 hour candles over a 14 month period, in purple. See how this volatility measure rose dramatically in early 2013, and has been trending upwards ever since, as shown by the black 200 EMA line of the true range. We begin this week noting that after having fallen, the volatility is flying back up again, making this cross an attractive instrument to trade, so we are on the lookout for a trading opportunity.

Signal 2
A highs and lows analysis of the 4 hour chart shows that we have been in a down trend since 22nd May. In a down trend, the highs all being lower is more significant than whether all the lows are lower. Here, all the major highs have been lower. After falling sharply, the price has come back up to the resistance zone of the most recent major high. We should take a closer look at this zone.

Closer Look at S/R Zone
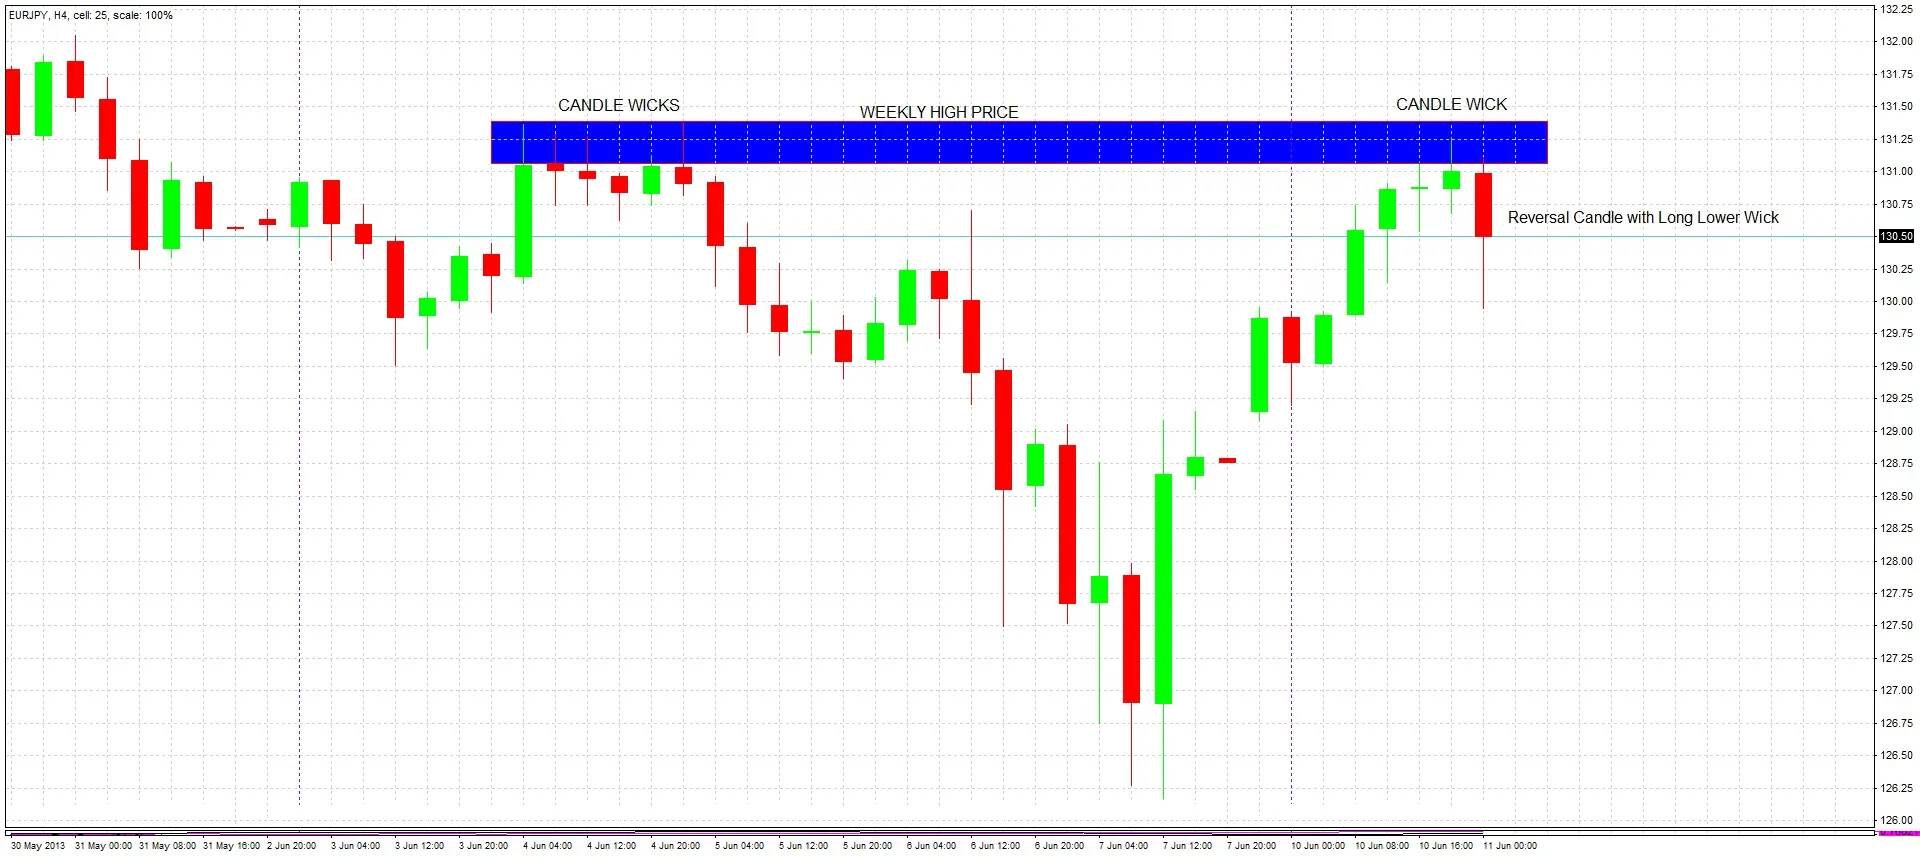
Looking more closely at the resistance zone we have hit, there are two important things to notice. First, this zone was at the high of last week, and weekly highs and lows often make powerful S/R zones. Second, the zone is well-defined by the similar wicks of 4 bars close together. These wicks show that the price repeatedly failed to break upwards through the resistance, suggesting that the resistance zone is strong and will hold. We can hope the resistance holds again and look to go short, but we need to wait for the strong upwards move to show a sign of turning around before we can enter.

Waiting for Trend Reversal
We are at the start of the Tokyo session, which is an active time for this cross as it includes JPY. Often the largest directional moves by JPY begin during the Tokyo session. We need to wait for the next 4 hour candles to form, to see whether they show the trend might be reversing, which would give us a signal to look for a short entry.
Bank of Japan Monetary Policy Statement
A couple of hours later, the Bank of Japan gives its monthly monetary policy statement. Many market players were expecting further measures by the Bank to weaken the JPY. No such measures were announced. This disappointment causes an immediate strengthening of the JPY, and the cross begins to fall. We watch and wait for the close of the 4 hour candle.
Reversal
Following the statement from the BOJ, the next candle on the 4 hour chart does not only close down, it closes below the open of the previous candle, printing a reversal. It also closes below the openings of the 2 bullish candles before that, which is a strongly bearish sign. However, we have to take account of the bullishly large lower wick of this candle, as we decide whether or not to prepare to enter a short trade.

Trade Decision
Despite the bullishly long lower wick of the reversal candle, we have a valid short signal. We need to choose our method of entry and where to put our stop loss. Note that the profit target should be the same, whatever we decide. Time to stop and think.

Option 1: Enter Immediately
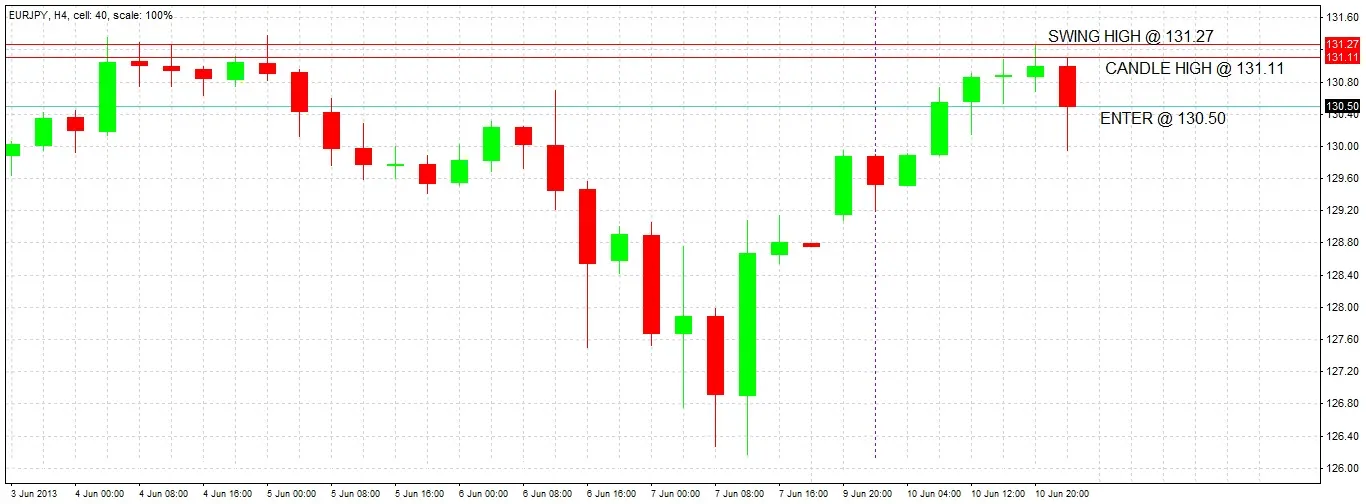
If we put our stop at the high of this candle, we would have a risk of 61 pips, or 76 pips if we put the stop at the swing high. Entering immediately would give us a better price than entering at a break of the low of the candle, but at the cost of not seeing downwards momentum before we enter and therefore taking a riskier trade.

Option 2: Enter at a Fast Break of the Low of the 4H Candle
If we put our stop at the high of this candle, we would have a higher risk of 117 pips, or 123 pips if we put the stop at the swing high. Entering at a fast break of the low of this candle would give us a worse price, but with the benefit of seeing downwards momentum before we enter, making it a higher-probability trade.

Option 3: Wait for a More Precise Entry in Lower Timeframe
A good signal candle in a lower timeframe would give us an opportunity to enter with significantly less pip risk. However, waiting for a lower timeframe signal that might never happen means we risk missing the opportunity completely. Also, the trade might be more risky, as the stop will probably be tighter, but for a higher reward. Right now, we have an inside bar on the 15 minute chart, which is a signal candle.
Option 1 Entry
If we had chosen Option 1, we would have entered at 130.50, risking 61 pips.

Option 3 Entry
If we had chosen Option 3, we would have entered at the break of this inside bar on the 15 minute chart, risking 11 pips.

Option 3 Stop Loss
If we had chosen Option 3, we would have been stopped out of the trade for a loss of 11 pips.

Option 3 Second Entry
If we had chosen Option 3, we get another entry signal and enter at the break of this reversal bar on the 15 minute chart, risking 20 pips. It is important not to let the earlier loss discourage us from entering again when we get another signal like this one.
Bank of Japan Press Conference
In a press conference following today’s earlier Monetary Policy statement, the Bank of Japan is more upbeat on Japan’s economic health than had been expected by the market. The JPY immediately begins to strengthen again, and this cross starts to fall further.

Option 2 Entry
If we had chosen Option 2, we would have entered at this fast break of the low of the 4 hour candle at 129.93, risking 117 pips with our stop loss at the high of the previous candle of 131.11.

Option 3 Second Stop Loss
If we had chosen Option 3, we would have been stopped out of our second entry for a loss of 20 pips. We would have lost a total of 31 pips on the two losing trades.

Option 3 Third Entry
If we had chosen Option 3, we would have been given another entry signal to enter at the break of this inside bar on the 15 minute chart, risking 12 pips. Note that we have now broken the low of the original 4 hour signal candle. We have already lost a total of 31 pips on the two previous losing trades. It is important that in spite of the losses, that we stick to our plan of allowing three entries to try to get a winning trade.
German Constitutional Court Begins Hearing Key Euro Case
The German Constitutional Court begins a two-day hearing into the European Central Bank’s government bond-buying programme. In the opinion of legal experts, there is a real chance that the court will issue a ruling that could effectively prevent the operation of the European Central Bank’s new bond-buying program, which the market would react to by selling off the Euro. During the day, global financial markets suffer very sharp moves, including a strong fall in the value of the Euro.

Trade Exit
We reach our target, the major low of 126.17 made on 7 June, after being in the trade for more than 48 hours, while waiting patiently through some pull-backs. We have successfully made a profitable trade.

Conclusion
If we had chosen Option 1, we would have made 1 winning trade, risking 61 pips and gaining 433 pips: a reward to risk ratio of 7.1. If we had chosen Option 2, we would have made 1 winning trade, risking 117 pips and gaining 377 pips: a reward to risk ratio of 3.2. If we had chosen Option 3, we would have made 2 losing trades and 1 winning trade, risking 43 pips and gaining 396 pips: a reward to risk ratio of 9.21. This shows that being prepared to make more risky multiple entries on a lower time frame can increase profitability, even if you have a couple of small losses before a successful attempt.
Note that the successful Option 3 entry on a lower timeframe came after the low of the 4 hour candle had been broken to the downside.
