Complete this quiz and
proceed to the next lesson
Start Quiz

A single trend line is a Forex trend indicator. It is one of several support/resistance indicators that can be used in Forex trading. When plotted on a graph, single trend lines can show the Forex trader a line which has a probabalistic edge of being a line of bargain prices.
This lesson will explain single trend lines and how they can be used to help determine Forex trade entries and exits.
I've mastered this topic, take me to the next lesson
We strongly recommend you open a free trading account for practice purposes.
Technical analysis (TA) is built on the assumption that prices trend and TA is used as a Forex trend indicator. Trend Lines serve as an important tool in technical analysis for both trend identification and confirmation. A trend line is a straight line that connects two or more price points and then extends into the future to act as a line of support or resistance. Many of the principles applicable to support and resistance levels can be applied to trend lines as well.
An uptrend line has a positive slope and is formed by connecting two or more low points. A downtrend line has a negative slope and is formed by connecting two or more high points.
Along with price levels, trend lines are one of the most basic kinds of s/r.
We’ll look at the four basic types:
1. Simple single up or downtrend lines
2. Channels, which are comprised of two parallel simple trend lines that capture most of the rising, falling, or flat price range for a given period
3. Moving averages (MAs)
4. Bollinger Bands (BBs), a variation on MAs
While these vary in complexity and appearance, the goal of all of them is to provide a clearer picture of the trend than we would see from just looking at the sequence of individual candles. There is a lot of demand for automated Forex trend indicators, but there is really no substitute for learning how to draw trend lines yourself.
1. Single Uptrend or Downtrend Lines
Figure 4.6 provides examples of:
Note the following points.
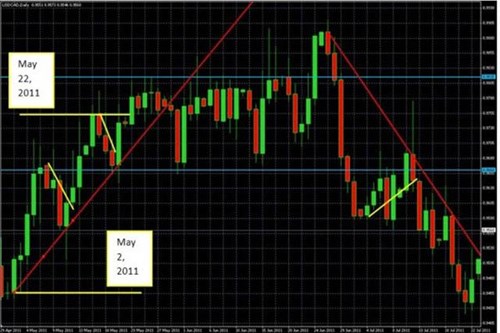
Source: MetaQuotes Software Corp, and The Sensible Guide To Forex: Safer, Smarter Ways to Survive and Prosper From The Start (Wiley & Sons, 2012)
Plotting An Uptrend Line
An uptrend is a series of higher lows and higher highs, as we see from May 2nd to the 22nd.
To plot an uptrend line, draw a line that connects as many of the higher lows of the candle bodies as possible, while best capturing the overall upward slope, even if that means having some candlesticks either not touching the line or crossing it. Trends rarely move in neat straight lines, so varying degrees of
overlapping candles are okay.
Plotting A Downtrend Line
A downtrend is a series of lower highs and lower lows. To plot a downtrend line, you want to connect as many of the lower highs as possible while best showing the overall downward slope. Again, it’s ok to have some outlier candlesticks.
Plotting A Flat Trading Range Requires Two Parallel Lines
By definition, a flat trend that moves neither up nor down requires two simple, parallel trend lines (called a channel) to describe the upper and lower end of the trading range. We’ll learn more about channels in the next article.
Again, feel free to ignore some of the outlier candles in order to better capture the overall direction.
Trend Lines Aren’t Meant To Be Exact S/R Points. As with any other kind of S/R, trend lines should be viewed as bands or areas of S/R rather than precise points, and candlesticks rarely line up in a straight rising, falling, or flat line. Thus, you can have a few outlier candlesticks or wicks above or below your uptrend line. The goal is to best capture the overall slope of the line. Again, variations in speed and direction within the overall trend are expected.
Trend Lines Usually Include Shorter Term Counter Trends. Even in strong trends, price typically oscillates up and down within the longer term overall direction. In other words, trends contain shorter term counter moves, as shown by the short counter trend lines within the up and down trends.
Follow us on:
![]()
![]()
![]()

We hope you found our site useful and we look forward to helping you again soon!


