Complete this quiz and
proceed to the next lesson
Start Quiz

Moving averages (or MAs) can be adapted to be momentum indicators as well as support/resistance markers. By plotting multiple moving averages of different time spans on our charts, we create a useful momentum indicator, the moving average crossover.
This lesson outlines the two types of moving average crossovers that can be used to indicate price momentum.
I've mastered this topic, take me to the next lesson
We strongly recommend you open a free trading account for practice purposes.
The use of Moving Average crossovers is a popular way for traders to use Moving Averages. A crossover occurs when a faster Moving Average (i.e. a shorter period Moving Average) crosses either above a slower Moving Average (i.e. a longer period Moving Average) which is considered a bullish crossover or below which is considered a bearish crossover.
Crossovers are thought to signal momentum change in the markets. When the main indicator crosses a predefined signal line, the trader will interpret this as a warning sign that something is changing with respect to either momentum of the price action, or its direction. But as we mentioned, crossovers are relatively common, and a strategy based on them alone is unlikely to work well in the absence of confirmation from other sources.
The signals generated by a crossover can be useful in a ranging or trending market, but in a trending market, a crossover is a less significant development than in a ranging market.
Moving Average crossovers are important tools in a trader’s toolbox and are included in the most popular technical indicators.
There are many other useful momentum indicators. One of them is moving average crossovers.
Like Bollinger Bands, moving averages can also be adapted to be momentum indicators as well as S/R markers. By plotting multiple moving averages of different time spans on our charts, we create a useful momentum indicator, the moving average crossover.
Moving averages can be adapted to be momentum indicators as well as S/R markers.
Moving average crossovers come in two types:
The first type is price which crosses over or under a given moving average
The second one is shorter-duration moving averages which cross over or under longer, slower moving
averages.
Each type signals changing momentum that could be an early signal of a changing price trend.
When the price crosses over or under an important moving average, that crossing can be a signal of a possible momentum change, which in turn signals a trend change.
Rather than rely on just DBBs to signal changes in momentum, you’ll get a more reliable signal of changes in momentum and trend by waiting for confirmation from one or more other momentum indicators, like MA crossovers.
For example, traders using both types of signals would not close a long position until BOTH of the following signals occur:
In other words, they wouldn’t bet on a trend change until they get both of the above signals confirming the end of an uptrend.
Let’s see this idea in action. Look at Figure 8.9 below. In addition to a set of Double Bollinger bands, there’s a 50-day SMA.
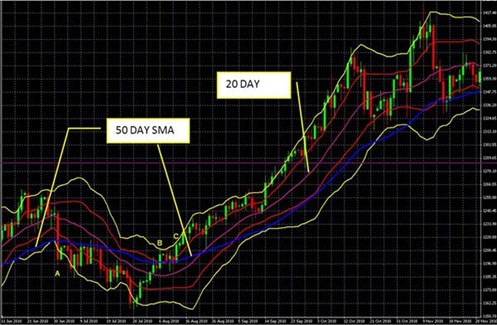
FIGURE 8.9 Gold Daily Chart, June 10 to September 30, 2010
Note that during the months of October and November of 2010, gold fell twice out of its upper DBB buy zone but never made a clear lasting move below its 50 day SMA.
Those who used only the DBB rules lost time and money closing and then re-entering long positions as gold bounced out of and back into its DBB buy zone.
In contrast, those who held their long positions until they saw confirmation that the uptrend was over from both of the two signals below, continued to ride the trend higher.
Similarly, traders using both indicators to confirm momentum changes might not take bets on new up trends until they get confirmation of strong upward momentum from both of the following signals:
Traders using both indicators to confirm momentum changes might not take best on new down trends until they got confirmation of strong downward momentum from both of the following signals:
Follow us on:
![]()
![]()
![]()

We hope you found our site useful and we look forward to helping you again soon!
