Complete this quiz and
proceed to the next lesson
Start Quiz

In this lesson we will introduce another type of support/resistance indicator—Fibonacci Retracements. The Fibonacci golden rule is based on certain mathematical relationships, expressed as ratios, between numbers in a series. Their discovery was popularized in the Western world by the thirteenth-century mathematician Leonardo Fibonacci. They have application in fields as diverse as biology, music, art, and architecture.
In this lesson, we will focus on only the relevant Forex Fibonacci applications.
I've mastered this topic, take me to the next lesson
We strongly recommend you open a free trading account for practice purposes.
All traders need to know about Fibonacci retracements is that there are certain percentages by which trends tend to retrace before continuing in their original direction. When a retrace begins, traders can mark these percentage levels, as a percentage of the trend's distance, and anticipate possible reversals at these levels, which can act as another form of S/R.
The key percentages are:
So far in FX Academy, we have considered two types of Support and Resistance:
These form the foundation of Technical Analysis in Forex and the wider financial markets. For example, most traders begin marking horizontal Support & Resistance levels when they begin analyzing any chart, especially if the price has reacted strongly at a specific price level or has reacted multiple times at the same price level.
Now let’s look at a completely different kind of S/R indicator called Fibonacci retracement, or fibs for short, that can be used for Fibonacci trading.
Fibonacci retracement Support & Resistance levels can be used on any timeframe. Much like the rest of traditional Technical Analysis, Fibonacci retracement Support & Resistance levels on higher timeframes are considered more reliable than ones on smaller timeframes.
As in any financial market, forex prices do not move straight up or down. Instead, they zigzag within their overall longer-term trends as markets test recent short-term support and resistance.
Look at the chart below:
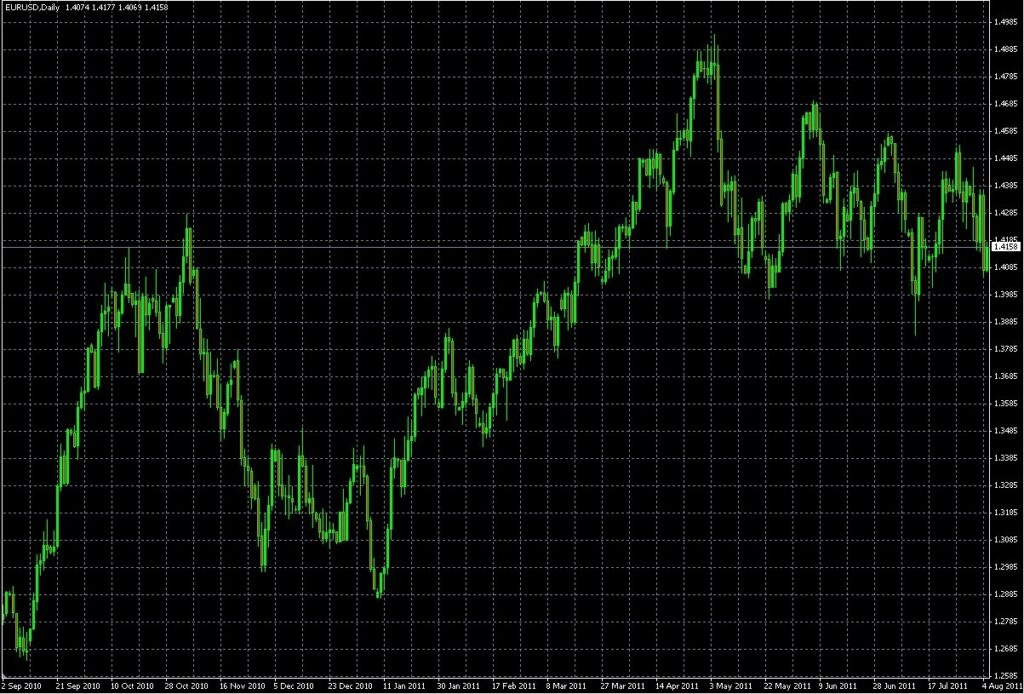
Source: MetaQuotes Software Corp, and The Sensible Guide To Forex: Safer, Smarter Ways to Survive and Prosper From The Start (Wiley & Sons, 2012)
Fibs help us determine where prices are likely to either make these repeated short-term reversals as they zigzag within their longer-term trends or make a longer-term reversal.
Fibonacci retracement Support and Resistance can be used independently on a chart or used in conjunction with traditional Support & Resistance analysis. Importantly, Fibonacci retracement Support and Resistance can identify areas of potential price reversals on a chart not found by other Technical Analysis tools.
It is worth investigating this fascinating area further.
Fibonacci Trading
Fibonacci trading is trading is based on certain mathematical relationships, expressed as ratios, between numbers in a series. Their discovery has been attributed to (at least in the Western world) the thirteenth-century mathematician Leonardo Fibonacci. These relationships have applications in fields as diverse as biology, music, art, architecture, and other fields. We will just focus on what is relevant for Fibonacci Forex.
The Fibonacci levels used in the financial markets will help you highlight future levels where the price may stall or reverse. Before we look at how to draw Fibonacci levels on a chart, we must establish which levels to use. There are multiple Fibonacci levels, and you probably do not want every level on your chart at the same time – this will only lead to confusion!
Fibonacci levels used in the financial markets are derived from a mathematical sequence known as, yes – you have guessed it – the Fibonacci sequence. This is a simple sequence that anyone can understand, and it is useful to learn where the Fibonacci levels come from before you put real money at risk on trades that may use these levels.
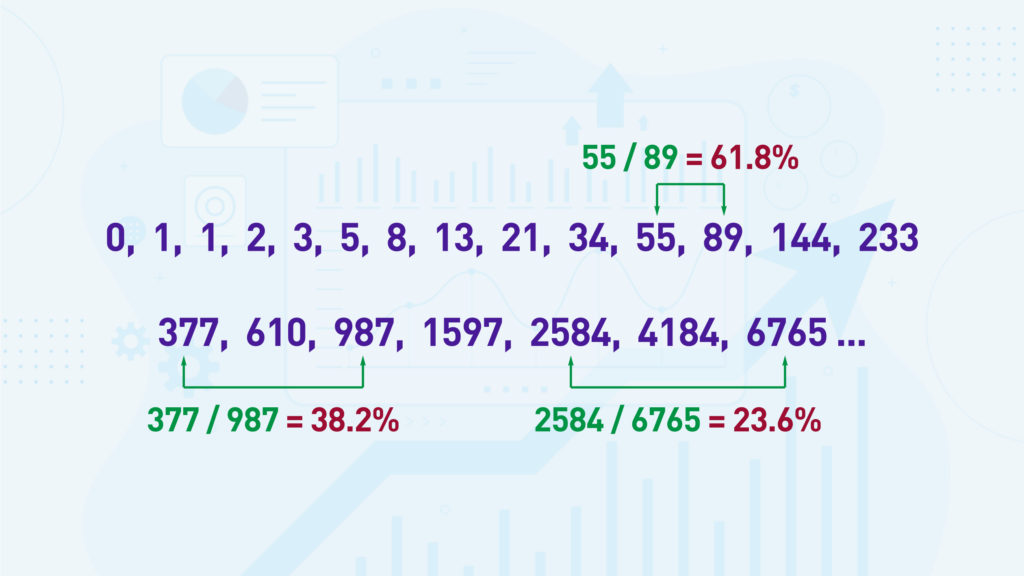
The Fibonacci sequence starts with the two numbers, 0 and 1. Every following number is the sum of the two previous numbers. The next number is again 1. After that, it is 2, and it builds into this sequence:
0, 1, 1, 2, 3, 5, 8, 13, 21, 34, 55, 89, 144, 233, 377, 610, 987, 1597, 2584, 4184, 6765 … and it goes on infinitely.
A number that’s in this sequence is known as a “Fibonacci number.” For example, 8 is a Fibonacci number. 233 is a Fibonacci number.
The Fibonacci levels are by taking one Fibonacci number and dividing it by another. For example, if you take 55 and divide it by the larger number next to it, 89, you get 0.618. Let’s go further down the Fibonacci sequence and try that again and see what happens. If you take the Fibonacci number 610 and divide it by the Fibonacci number next to it, 987, you again arrive at 0.618. This happens anywhere down the Fibonacci sequence. Of course, the numbers towards the beginning of the Fibonacci sequence do not neatly arrive at 0.618 only because of rounding errors.
In fact, 0.618, or 61.8%, is considered the most important Fibonacci level and is known as The Golden Ratio.
Moving on from 61.8%, how do we find the other Fibonacci levels used in the financial markets? If you take a Fibonacci number and divide it by another Fibonacci number two paces across from it, for example, 89 divided by 233, you arrive at 0.382, or 38.2%.
The third commonly used Fibonacci level takes two Fibonacci numbers that are 3 places apart on the Fibonacci sequence, for example, 55 divided by 233, which gives 0.236 or 23.6%.
Another popular Fibonacci level is 50%. However, strictly speaking, this is not a Fibonacci level, but it is used in conjunction with Fibonacci levels. Where did the 50% level come from? Before trading was electronic, it was conducted on physical trading floors, also known as trading pits, with traders yelling buy and sell orders at each other. These traders would often instinctively know when the price of what they’re trading has moved back halfway, i.e. 50%, between a previous high and low, and it became a point where they could enter the market. This was termed the “half-way-back” trade. Even though most trading today is conducted electronically, including in the Forex markets, 50% has remained an important psychological level used by traders worldwide.
Therefore, the key Fibonacci levels used in the financial markets are:
23.6%
38.2%
50%
61.8%
Traders found that trends tend to retrace prior moves according to these very same ratios, which in percentages translate to 23.6 percent, 38.2 percent, 50 percent, 61.8 percent, and 100 percent of a given trend.
For example, when a downtrend is finished, as it moves higher and ‘retraces’ the downtrend, it tends to pause or reverse after it has recovered 23.6%, 38.2%, 50%, 61.8% and 100% of the prior downtrend.
By drawing lines that show the percentage retracements of a prior trend on their charts, traders can better predict where future price moves might stall or reverse.
There is much argument as to why trends tend to pause or reverse after recovering these percentages of the prior trend, but they do. So, view fibs like electricity. They work, so you can use it even though you may not understand why it works. The proof that they work is that they have become another widely accepted and watched S/R indicator.
As with any technical indicator, now that fibs have become widely accepted and watched, they create a degree of self-fulfilling prophecy, and so become even more useful for anticipating price movements.
Here is an illustration of how Fibonacci works.
If you look at the chart below you will see an example of Fibonacci trading in action. This is the same chart as we saw above, with Fib levels (horizontal lines) drawn in for the range of the downtrend of December 2009 to June 2010. Note how well the Fibs predict S/R as the EUR/USD currency pair begins an uptrend that retraces the prior downtrend.
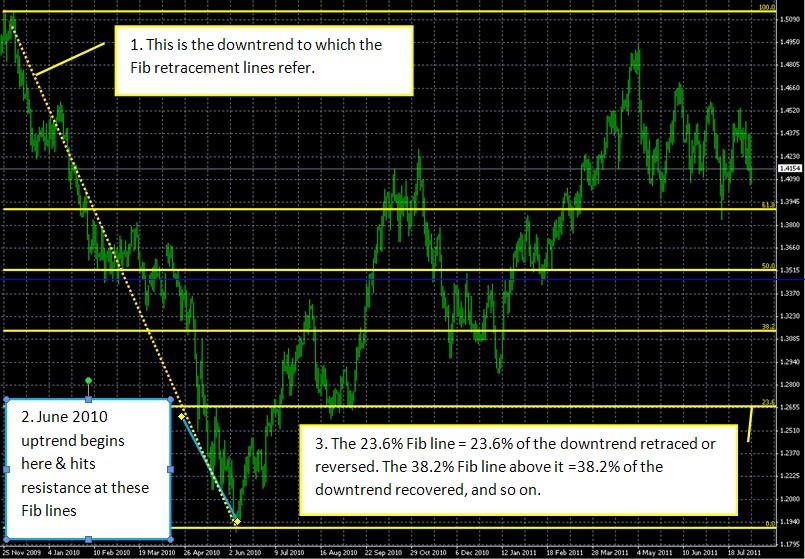
Source: MetaQuotes Software Corp, and The Sensible Guide To Forex: Safer, Smarter Ways to Survive and Prosper From The Start (Wiley & Sons, 2012)
What is Fibonacci Trading?
Every trader that studies Technical Analysis will sooner or later come across the concept of Fibonacci levels and instinctively ask the question, what is Fibonacci trading?
Fibonacci trading is the practice of using Fibonacci levels on a chart between recent highs and lows, for example, 23.6%, 38.2%, and 61.8%, to find future price areas where the price may react strongly – either an area where price may pause or reverse direction.
References to the Fibonacci Sequence and the Golden Ratio have appeared as early as the 12th century in India and in Europe. Fibonacci applications to trading have been around for decades. Still, they have grown strongly in popularity partly because of the growth of technical analysis (Fibonacci levels are a form of Technical Analysis). Modern trading tools make drawing Fibonacci levels very easy on a chart, making Fibonacci trading even more popular today.
Fibonacci trading can be used as a standalone mechanism for analyzing charts and placing trades, or it can be used in conjunction with almost any other technical tools, from Moving Averages, Stochastics, RSI, traditional Support & Resistance analysis… the list goes on.
Fibonacci trading is relatively easy to learn, and using it successfully is about practice, practice, and more practice.
This series of lessons in FX Academy not only aims to answer the question “What is Fibonacci trading?” but also, “How do we use Fibonacci trading?”.
Fibonacci Can Be a Powerful Tool
Technical Analysis indicators can be divided into two broad categories: “leading indicators” and “lagging indicators.”
As the terms suggest, a “leading indicator” helps lead price action and, consequently, is predictive in nature. The role of a leading indicator is to point out the future direction of price action, for example, by pointing out levels that price may hit or levels where price may turn around and reverse.
Conversely, a “lagging indicator” is more descriptive of past price action and less predictive in nature. Lagging indicators help tell us what has led up to the present moment and the market’s current state. For example, Moving Averages are considered lagging indicators – they can tell is if a trend is strong or weak.
Fibonacci can be a powerful tool precisely because it is a leading indicator. This is important because we want to know where the price will react in the future, in other words, which levels will pause or reverse the price in the future. Remember, trading is less about describing past events; rather, it is more about understanding how the price will move going forward. After all, we cannot not trade past price moves; we can only trade future price moves. From that perspective, you should consider Fibonacci retracement Support and Resistance a critical part of your trading toolkit.
As you can also learn in these lessons, Fibonacci can be a powerful tool due to its intrinsic mathematic nature outside of the financial markets. Read on to learn about the key 61.8% level.
Follow us on:
![]()
![]()
![]()

We hope you found our site useful and we look forward to helping you again soon!
