Complete this quiz and
proceed to the next lesson
Start Quiz

This lesson on Fibonacci Retracement will illustrate how to find minor support/resistance points which a trader may not see in a higher time frame.
The FX Academy recommends utilizing multiple time frame analysis in intervals of approximately 4X shorter and/or longer, for example 1 Day, 4 Hour and 1 Hour charts of the same pair or cross, together at the same time.
I've mastered this topic, take me to the next lesson
We strongly recommend you open a free trading account for practice purposes.
When studying Fibonacci retracements, why do we study multiple time frames before choosing a trade?
Regardless of whether we trade from hourly, four-hour, daily, weekly, or other time frame charts, it is useful to view charts with the same indicators in both longer and shorter time frames.
Fibonacci Retracement Levels
The goal of this exercise is to find S/R points you would not otherwise see in your main time frame. Once you are aware of these shorter and longer-term S/R points, you will not be surprised if a trend pauses or reverses because of them. So, you will be warned about trades that are not as promising as they looked in your main trading time frame.
Generally, we want to see S/R on charts with time frames about 5 times shorter and longer than we normally use.
For example, if you trade from hourly candlestick charts, you would choose 5 minute and 4-hour charts to see shorter and longer-term S/R. If you trade from daily charts, you would want to use 4-hour charts to see shorter term S/R points and use weekly charts to see stronger S/R points.
If this sounds confusing, look at a good illustration using Fibonacci retracements of how shorter-term S/R points lurk within longer timeframes.
We will illustrate this point using fibs because unlike other kinds of S/R, you can see the shorter and longer-term S/R areas all at once on one chart, by plotting sets of fibs for the shorter term up and down trends that occur within a longer trend.
See the chart below.
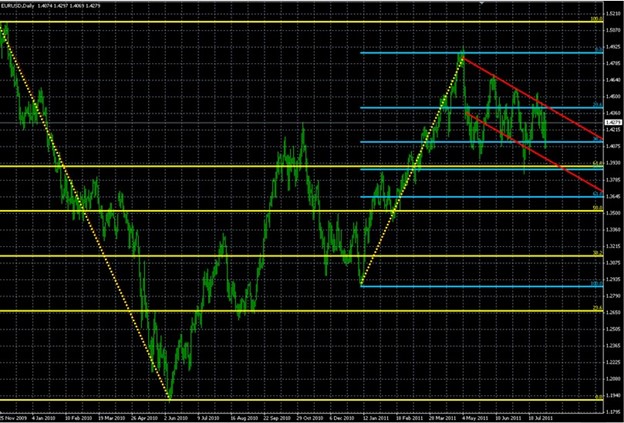
Source: MetaQuotes Software Corp, and The Sensible Guide To Forex: Safer, Smarter Ways to Survive and Prosper From The Start (Wiley & Sons, 2012)
In this graph we have plotted 2 sets of Fibonacci retracement levels, one based on both the longer-term downtrend on the left (long yellow fib lines) and on the shorter-term uptrend on the right (shorter blue fib lines).
The key point here is that we plotted 2 sets of fibs, one (blue) based on the shorter-term uptrend on the right and the other (yellow) based on the longer-term downtrend on the left.
We should take note of how the second “nested’ set of blue fibs, based on that uptrend, show us possible S/R points we might not have otherwise anticipated for the latest move lower.
We should also take notice of how well those blue fibs indeed predicted where the latest move lower would pause or reverse.
Here is another interesting piece of information regarding Fibonacci numbers:
There is a special ratio that is used to describe the foundation for an incredible mathematical relationship behind phi. This is the Fibonacci sequence (1, 1, 2, 3, 5, 8, 13, 21, 34, 55, 89, 144 . . .) and it occurs throughout the worlds of nature, art, music, and mathematics! It is called the ‘golden ratio’ and in the financial arena, it is referred to as the Fibonacci golden ratio.
More on The Golden Ratio
Firstly, remember that the Fibonacci Sequence (and the Fibonacci Ratios derived from it), including the Golden Ratio, were discovered as early as the 12th century as a purely mathematical sequence. This is important because many of the Technical Analysis tools and indicators used today by traders are specific only to trading the markets and are not used outside of this activity. Whereas Fibonacci, because it is first a mathematical property, will more likely stand the test of time within the markets, as it has a universal scientific framework.
The golden ratio is sometimes called the "divine proportion" because of its frequency in the natural world. The number of petals on a flower, for instance, will often be a Fibonacci number. The seeds of sunflowers and pinecones twist in opposing spirals of Fibonacci numbers. Even the sides of an unpeeled banana will usually be a Fibonacci number—and the number of ridges on a peeled banana will usually be a larger Fibonacci number.
It stands to reason that the Golden Ratio, which is found all over the natural world, would eventually find its way into the financial markets. It is worth noting that the financial markets represent crowd psychology and its imprint on price data, and crowd psychology is a natural system.
Follow us on:
![]()
![]()
![]()

We hope you found our site useful and we look forward to helping you again soon!
