Complete this quiz and
proceed to the next lesson
Start Quiz

Using Fibonacci retracement indicators on a graph is an excellent way to show Fibonacci levels.
Applying Fibonacci retracement is not difficult at all. In this lesson, we will show how to draw FIBS in easy steps.
Utilizing Fibonacci Forex retracement ratios as a support/resistance indicator can be a simple, useful tool.
I've completed all lessons on this course, take me to the course syllabus page
We strongly recommend you open a free trading account for practice purposes.
Fibonacci Trading Software and Fibonacci Retracement Indicators
Because of the popularity of Fibonacci amongst the trading community today, there is a huge choice of Fibonacci trading software and Fibonacci retracement indicators available to traders. In fact, every single charting platform we have tested can draw Fibonacci retracement levels on the price chart. This is true for Forex platforms, such as the highly popular MetaTrader MT4 platform, and for multi-asset class platforms, such as TradeStation, Ninja Trader, Sierra Chart. Even web-based platforms such as TradingView incorporate comprehensive Fibonacci retracement indicators.
Although there are widely respected Fibonacci retracement levels such as 61.8% and 38.2%, Fibonacci Trading software and Fibonacci retracement indicators almost always allow you to add other levels to the indicator. For example, 50% is commonly used with Fibonacci Forex analysis even though it is not strictly speaking a Fibonacci ratio. 78.6% (which is the square root of 0.618 or 61.8%) is also a widely used level. MetaTrader MT4, for example, allows the addition of these additional levels. Most Fibonacci trading software and Fibonacci retracement indicators also allow you to add levels that are greater than 100%. These are called “Fibonacci Extensions”. Very popular Fibonacci Extension levels are 123.6% and 161.8%. Fibonacci Extensions are often used by traders as price targets to take profits.
Because the application of technical indicators can vary among charting software packages, we usually do not cover how you apply a given indicator on your charts. Regarding Fibonacci retracements, however, it is worth demonstrating the general mechanics of how you draw them, and the technical analysis involved in them, because you will gain a better understanding of what Fibonacci levels you are really measuring and how they are defined by whatever prior trend you select.
You can apply Fibs to your charts basically in a three-step process.
STEP 1 : You select a high and low point for a given uptrend or downtrend
STEP 2 : Your charting software then calculates where a retracement of 23.6 percent, 38.2 percent, 50 percent, 61.8 percent, and 100 percent of that trend would occur, and
STEP 3 : It then draws in lines at those price levels.
Per Fibonacci theory, these are where the future counter trend is most likely to pause or reverse.
Using the Fibonacci Retracement Tool in MetaTrader
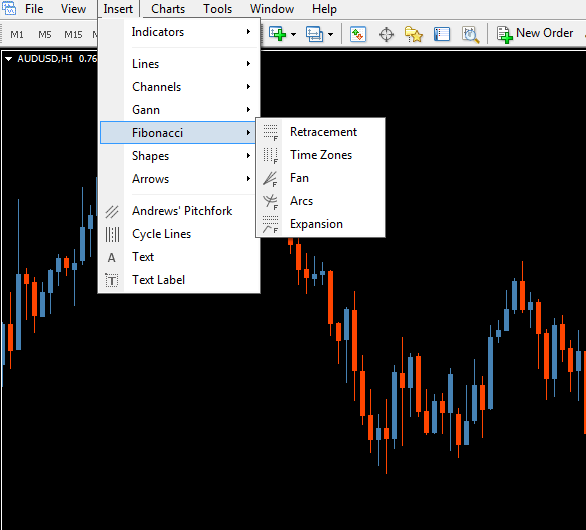
There are several ways to accessing and using the Fibonacci Retracement tool in MetaTrader. You can access it directly from the menu at the top by going to Insert > Fibonacci. You’ll notice immediately that the MetaTrader MT4 platform has several Fibonacci tools available: Retracement, Fibonacci Time Zones tool, Fan, Arc, and Expansion. MetaTrader MT4 places Retracement at the top of the list, given it is the most popular style of Fibonacci Forex analysis.
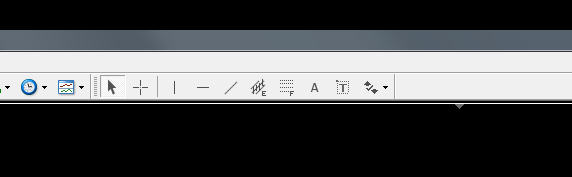
You can always keep the Fibonacci retracement tool available at the top by View > Toolbars > Line Studies.
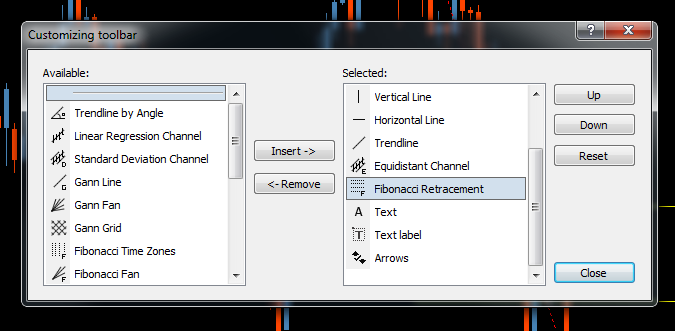
If, for any reason, the Fibonacci retracement tool is not there as part of the Line Studies buttons, right-click in that area and go to Customize. A new window will pop up, allowing you to add the Fibonacci Retracement tool to the menu bar.
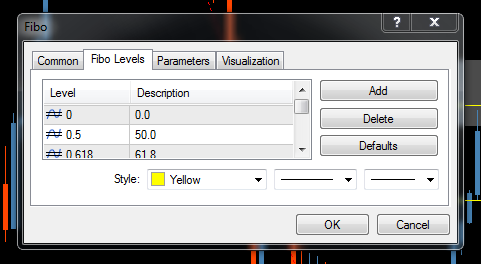
Using the Fibonacci Retracement tool in MetaTrader is a simple matter of selecting the tool and clicking and dragging it between two points in a chart, for example, between a high and low. If you want to add or modify Fibonacci levels, right-click the diagonal line that connects the high and low of the Fibonacci levels, and select Fibo Properties.
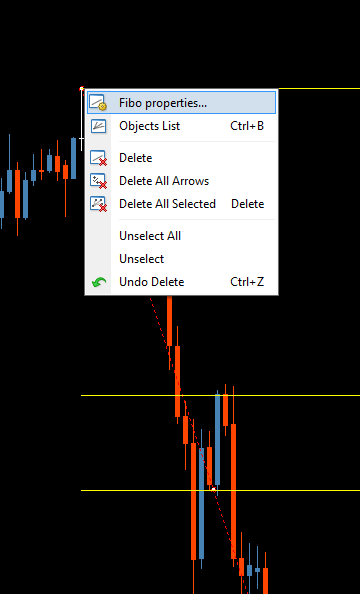
This will give you a pop-up box where you can modify the tool, from adding or subtracting levels, renaming the levels, changing the colors, having the Fibonacci levels only show up specific timeframes, and so on.
This will give you a pop-up box where you can modify the tool, from adding or subtracting levels, renaming the levels, changing the colors, having the Fibonacci levels only show up specific timeframes, and so on.

The tool in MetaTrader recognizes the Fibonacci levels as decimals and not percentages. If you want 61.8%, this would be 0.618 in the tool. Of course, you are free to label the level as you see fit; for example, you can call the 0.618 level either “61.8%” or “Golden Ratio” or anything else you like.
Fibonacci Technical Analysis
When doing Fibonacci technical analysis, most charting software instructions will guide you with exact instructions as to which steps are needed. They usually involve just doing the following:
Decide which Fibonacci levels you wish to measure.
Select Fibonacci retracements from your menu of available technical indicators.
Indicate the price range and time period of prior trend in question by highlighting it with a simple click and drag of your mouse. Here are some examples below.
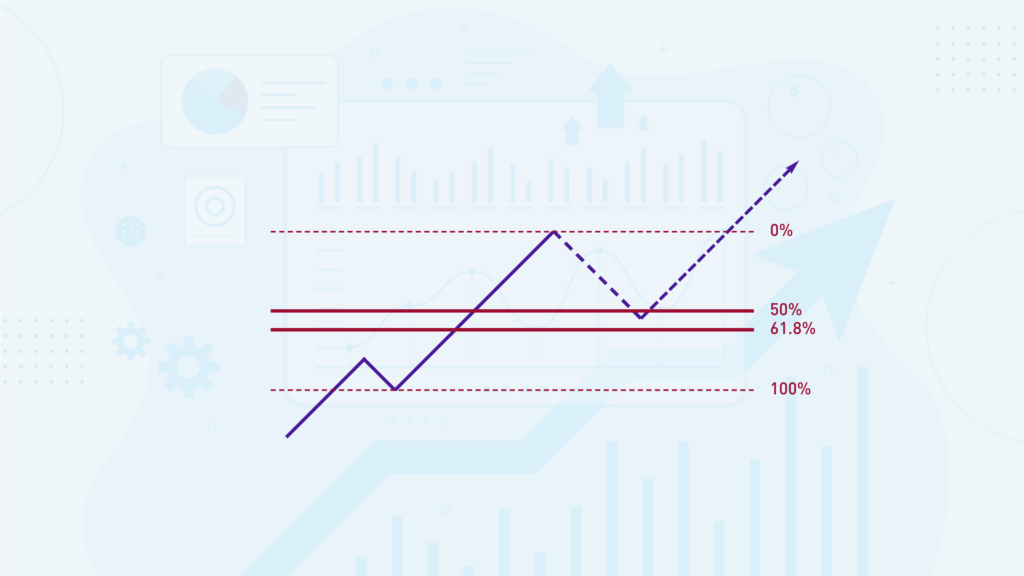
Drawing Fibonacci Retracement Levels in an Uptrend
When drawing Fibonacci Retracement levels in an uptrend, you must be confident that you have a clean, definable trend to draw your lines. The feature that defines an uptrend is a series of higher lows. Of course, alongside that, you want to see higher highs.
Once you have identified an uptrend, the next step is to find the most recent low to the most recent high to draw your Fibonacci retracement levels. Importantly, the 100% Fibonacci retracement level should be at the low, and the 0% Fibonacci retracement level must be at the high. If you are using the MetaTrader MT4 Fibonacci Retracement tool, that means you click and drag from low to high on the chart. Depending on how you have set up your Fibonacci retracing tool, you should see 0%, 100% and levels in between such as 50% and 61.8%.
Now, drawing Fibonacci Retracement levels in an uptrend will show you how far the price could retrace before resuming the uptrend. For example, this information could give you an idea of a suitable place to enter the market if you want to go long.
This will give you a pop-up box where you can modify the tool, from adding or subtracting levels, renaming the levels, changing the colors, having the Fibonacci levels only show up specific timeframes, and so on.
The tool in MetaTrader recognizes the Fibonacci levels as decimals and not percentages. If you want 61.8%, this would be 0.618 in the tool. Of course, you are free to label the level as you see fit; for example, you can call the 0.618 level either “61.8%” or “Golden Ratio” or anything else you like.
Fibonacci Technical Analysis
When doing Fibonacci technical analysis, most charting software instructions will guide you with exact instructions as to which steps are needed. They usually involve just doing the following:
Decide which Fibonacci levels you wish to measure.
Select Fibonacci retracements from your menu of available technical indicators.
Indicate the price range and time period of prior trend in question by highlighting it with a simple click and drag of your mouse. Here are some examples below.
Drawing Fibonacci Retracement Levels in an Uptrend
When drawing Fibonacci Retracement levels in an uptrend, you must be confident that you have a clean, definable trend to draw your lines. The feature that defines an uptrend is a series of higher lows. Of course, alongside that, you want to see higher highs.
Once you have identified an uptrend, the next step is to find the most recent low to the most recent high to draw your Fibonacci retracement levels. Importantly, the 100% Fibonacci retracement level should be at the low, and the 0% Fibonacci retracement level must be at the high. If you are using the MetaTrader MT4 Fibonacci Retracement tool, that means you click and drag from low to high on the chart. Depending on how you have set up your Fibonacci retracing tool, you should see 0%, 100% and levels in between such as 50% and 61.8%.
Now, drawing Fibonacci Retracement levels in an uptrend will show you how far the price could retrace before resuming the uptrend. For example, this information could give you an idea of a suitable place to enter the market if you want to go long.

If you believe you are in a strong uptrend with shallow pullbacks, you may want to use a shallow Fibonacci retracement level, such as 38.2%, to enter the market. If the trend has displayed strong countertrend pullbacks, you may opt for a larger Fibonacci retracement level to enter the market, such as 61.8%, or even 78.6% (the square root of 0.618 or 61.8%).
In the first example we will draw fibs S/R for an uptrend based on a prior downtrend.
In the figure below, we wanted to locate the likely fib S/R points as the EURUSD rallied higher and thus “retraced” the prior down trend that occurred from December 2009 to June 2010. This is highlighted by the falling dotted line on the left side of the chart. The horizontal yellow lines mark those fib retracement levels that should become S/R points.
To do that you:
Select the Fibonacci retracements option from the menu of technical indicators.
At that point, the mouse cursor will change appearance to prompt us to highlight or define the range of the downtrend that we’re examining.
When that happens, place your mouse cursor where the downtrend began, left click and drag the cursor down and to the right until it hits where the down trend ended; then release the left mouse button. The yellow dotted line shows the price range that was highlighted. Now you can choose the absolute highs and lows of the candle wicks or use the highest and lowest closing prices per the candles’ bodies, on each end of the down trend’s range.
The horizontal yellow Fibonacci levels then appear. These serve as S/R zones for whatever uptrend that follows. Note the dotted line that highlights the down trend on which these fib lines are based. For example, the 23.6% fib line means that price has risen, or recovered, or retraced, 23.6% of the prior downtrend.
As with any other kind of S/R, each level is resistance until it is decisively breached, and then it becomes support unless price falls back below it.
Notice how the 23.6% fib line, the second yellow line from the bottom, indeed looks like its 23.6%, or about 25%, of the total downtrend. Note how the fourth line up looks like it is approximately in the middle of the downtrend. That is because it is the 50% retracement level, marking where half of the downtrend has been recovered or reversed.
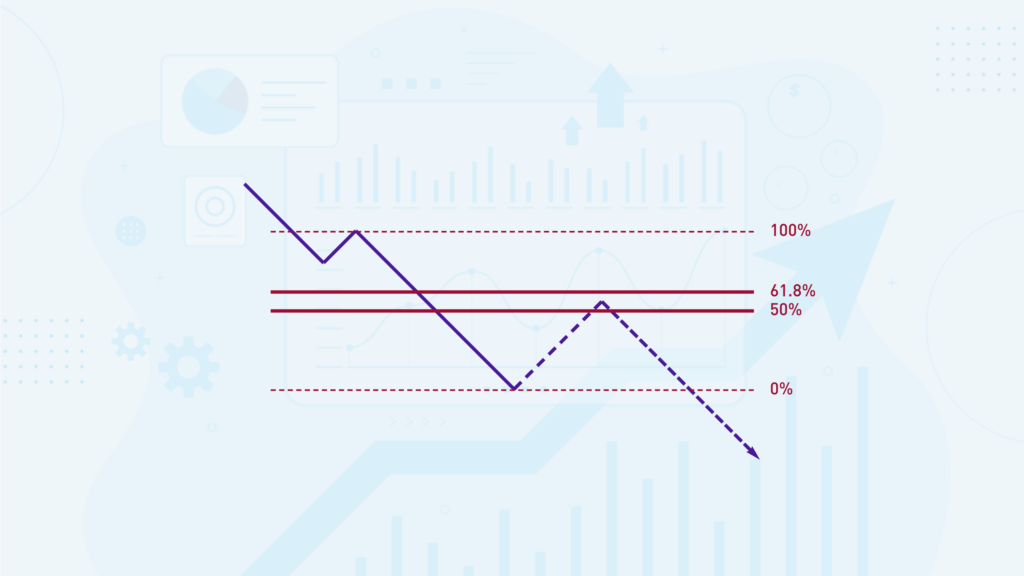
Drawing Fibonacci Retracement Levels in a Downtrend
When drawing Fibonacci Retracement levels in a downtrend, you must be confident that you have a clean, definable trend to draw your lines – the same as with an uptrend. The feature that defines a downtrend is a series of lower highs. Of course, alongside that, you want to see lower lows.
Once you have identified a downtrend, the next step is to find the most recent high to the most recent low to draw your Fibonacci retracement levels. Importantly, the 100% Fibonacci retracement level should be at the high, and the 0% Fibonacci retracement level must be at the low. If you are using the MetaTrader MT4 Fibonacci Retracement tool, that means you click and drag from high to low on the chart. Depending on how you have set up your Fibonacci retracing tool, you should see 0%, 100% and levels in between such as 50% and 61.8%.
Now, drawing Fibonacci Retracement levels in a downtrend will show you how far the price could retrace before resuming the uptrend. For example, this information could give you an idea of a suitable place to enter the market if you want to go short.
If you believe you are in a strong downtrend with shallow pullbacks, you may want to use a shallow Fibonacci retracement level, such as 38.2%, to enter the market. If the trend has displayed strong countertrend pullbacks, you may opt for a larger Fibonacci retracement level to enter the market, such as 61.8%, or even 78.6% (the square root of 0.618 or 61.8%).
In the second example we are drawing fibs S/R for a down trend based on a prior uptrend.
To plot Fibonacci levels for a down trend, you follow the same steps as above. The only difference is that in step #3, we highlight the range and duration of a prior uptrend. That means we place our mouse cursor at the bottom of wherever the relevant up trend began, left click and drag the mouse up and to the right, and release the left mouse button at the high of the uptrend.
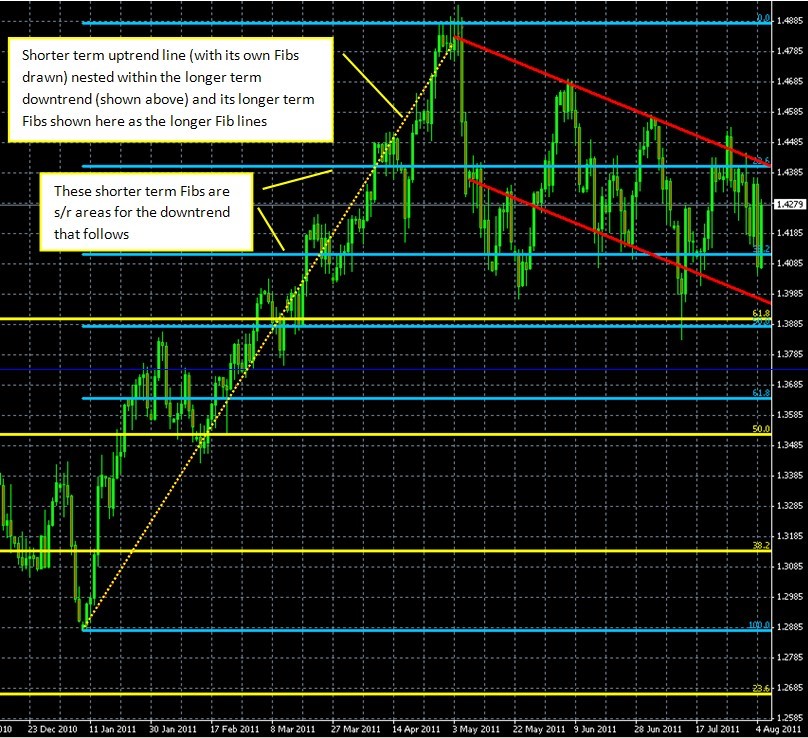
To solidify our understanding, let us review these steps. We refer to the graph below:
In the second example we are drawing fibs S/R for a down trend based on a prior uptrend.
To plot Fibonacci levels for a down trend, you follow the same steps as above. The only difference is that in step #3, we highlight the range and duration of a prior uptrend. That means we place our mouse cursor at the bottom of wherever the relevant up trend began, left click and drag the mouse up and to the right, and release the left mouse button at the high of the uptrend.
To solidify our understanding, let us review these steps. We refer to the graph below:

Source: MetaQuotes Software Corp, and The Sensible Guide To Forex: Safer, Smarter Ways to Survive and Prosper From The Start (Wiley & Sons, 2012)
Fibonacci retracements
Select the Fibonacci retracements option from our menu of technical indicators.
The mouse cursor changes appearance to prompt us to highlight or define the range of the relevant uptrend.
To do that, place your mouse cursor where the uptrend began, left click and drag the cursor up and to the right until the top of the uptrend; then release the left mouse button. Again, the dotted line shows the price range highlighted. Here too, you can choose the absolute highs and lows or use the highest and lowest closing prices for the candles on each end of the trend’s range.
The fib retracements lines then appear as blue horizontal lines. Ignore the yellow ones for now, we will explain those below. These blue lines indicate S/R zones for whatever down trend that follows. Note the dotted line that highlights the uptrend on which these Fibonacci levels are based. For example, the second blue line from the top is the 23.6% fib line, and it indeed is about 25% down from the high of the prior uptrend. When price falls to that level, it means that price has fallen 23.6% from its recent high. In other words, it has retraced 23.6% of the prior uptrend.
Like any other kind of S/R, each level is resistance until it’s decisively breached, and then it becomes support unless price falls back below it.
Now look again at the graph. Where do those longer yellow lines come from? These longer yellow lines are the Fibonacci levels based on the longer-term downtrend shown in this lesson’s first figure.
How to Draw a Fibonacci Retracement
Drawing Fibonacci retracement levels takes practice, practice and more practice. The most critical element is understanding the context of the price chart, in other words, the current market conditions. Are we in a range? Is there a strong trend? A Fibonacci Retracement will be mapping out where you think the price may retrace to and rebound, but it is up to you as a trader to decide where to draw the retracement levels and when to act on them.
Just like much of Technical Analysis, higher timeframe Fibonacci retracement levels will be superior to retracement levels on lower timeframes.
Always choose prominent lows and highs on a chart to pick the 0% and 100% points of your Fibonacci retracement levels. And remember, it’s no point thinking the price will bounce off a Fibonacci level if that level is in the middle of a range.
When considering how to draw a Fibonacci Retracement level, consider that you may have Fibonacci levels that coincide with other Support & Resistance levels. In Technical Analysis, this is known as confluence and is a good way of further confirming your chosen levels’ validity.
You can also use other indicators to help confirm your Fibonacci retracement levels. For example, if the price is coming down to your 61.8% level for a potential long entry, you could wait for the RSI to cross the 50 level before entering the trade.
Finding Fibonacci Retracement Levels
Finding Fibonacci retracement levels begins with choosing which levels you want to use for your trading.
The most important level by far is the 0.618 or 61.8% - this is the Fibonacci Golden Ratio. When people think about finding Fibonacci retracement levels, this level is always included.
The next most important is the 50% level. It is not strictly a Fibonacci level, but it holds huge psychological importance in trading and has been used in the markets for as long as the 61.8%.
Next up in the order of importance is the 38.2% level and 23.6% level. These would represent shallow retracements or pullbacks. Strong trends, for example, by definition, have very shallow pullbacks. They may not correct to a 50% retracement, so you will need a shallower Fibonacci retracement level to find an entry point into the market.
These 3 levels are the most important for finding Fibonacci Retracement levels on a chart. From this point on, we get into the territory of applying further mathematics to the Fibonacci ratios.
The first part of this process is to square root the Golden Ratio, i.e. the square root of 0.618, which gives you 0.786 or 78.6%. Some traders will square root this again to arrive at 0.886 or 88.6%. These two additional levels allow for deeper pullbacks. Perhaps you’re in a trend with deep pullbacks where even 61.8% is too shallow for you to enter the market.
You do not have to use all the levels, all the time. Stick to a few key levels and only alter them if you have a good reason, for example, if market conditions have changed.
Follow us on:
![]()
![]()
![]()

We hope you found our site useful and we look forward to helping you again soon!
