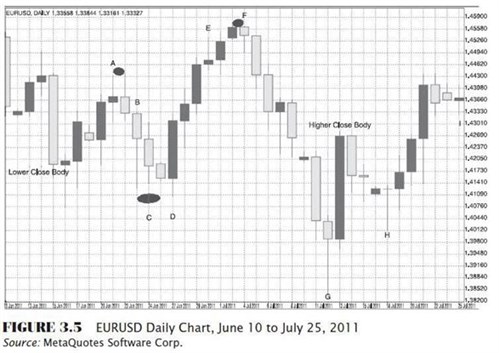
This lesson reviews what has been taught up to this point about candlestick analysis and support and resistance levels by taking you, step by step, through a real historical EUR/USD candlestick chart.
I've completed all lessons on this course, take me to the course syllabus page
We strongly recommend you open a free trading account for practice purposes.
Now you try to apply what you’ve learned about candles and support/resistance.
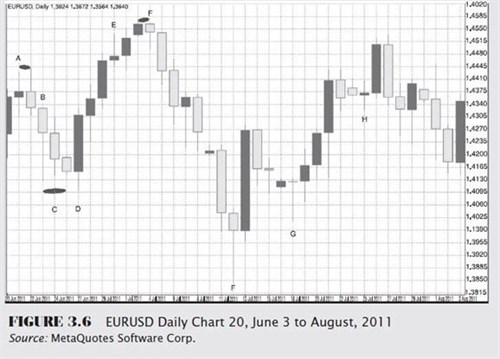
Here’s the chart we just saw.

What happened to the EUR/USD after the indecisive doji of July 25th?
Consider the following evidence:
The EUR/USD had five straight days of gains, the last three with increasing strength.
Looking at the month covered by this daily chart, the current price level of 1.4409 has served as near-term resistance because looking at the far left, middle, and far right sides of the chart, the pair has already failed twice before to make a sustained move above it.
The current price level of 1.4409 is essentially the same as 1.4400.
It is important to remember that round numbers tend to serve as natural support/ resistance because humans are psychologically wired to think in terms of round numbers. The more zeros, the more psychologically significant the number.
July 25 (I) shows a doji candle, a classic sign of indecision.
For the sake of simplicity, let’s ignore the overall bearish fundamental factors that were behind the July price declines, and just focus on the evidence on the chart.
So, what do you think happened? Do you think the pair finished the day higher, lower, or the same?
Write down your answer, and include your reasons.
Here’s what really happened:

If you thought the price would pull back, you were right. In Figure 3.6, after the undecided doji, the pair made a head-fake higher and pulled back (note the 2 candles that follow I).
We’ll talk more later about these “false breakouts,” why they happen, and what you can do to protect yourself against being fooled by them.
Ideally, your reasons should have gone something like this.
The pair was at a significant near-term resistance level and was showing indecision. The more likely move is a pullback as traders who bought at lower prices take profits from the prior solid run higher. Markets expect some pullback, so unless new bullish news arrives, the element of self-fulfilling prophecy operates.
This lesson aims to continue the previous lesson’s demonstration of candlesticks and S/R by talking through how S/R affected the progress of a real-life candlestick chart.
Do not be worried if you find this lesson confusing or hard to understand. It contains a lot of new information, and it is not important that you memorize any new concepts at this stage.

We hope you found our site useful and we look forward to helping you again soon!


