In this lesson, we will talk about the use of Moving Averages (MAS) in Forex trading.
Like simple trend lines and price channels, moving averages can act as another type of trend line that helps clarify a price trend because they smooth out the gyrations of individual price or candle movements.
Moving average lines for a given period don’t plot the actual price at a given moment. Instead, each point on these lines is the average closing price of a certain number of prior candlesticks or periods.
As each new closing price is added, the oldest one is dropped from the calculation, hence the term “moving average”.
I've mastered this topic, take me to the next lesson
We strongly recommend you open a free trading account for practice purposes.
Momentum indicators are frequently used in technical analysis showing the average value of a currency’s price over a set period. Moving averages are generally used to measure momentum and define areas of possible support and resistance.
Moving averages are used to emphasize the direction of a trend and to smooth out price and volume fluctuations, or "noise", that can confuse interpretation.
Typically, upward momentum is confirmed when a short-term average (e.g.15-day) crosses above a longer-term average (e.g. 50-day).
Downward momentum is confirmed when a short-term average crosses below a long-term average.
Like simple trend lines and channels, moving averages (or MAs) are another kind of trend line that helps clarify a trend because they smooth out the gyrations of individual price or candle movements.
As the name implies, moving average (MA) lines for a given period don’t plot the actual price at a given moment. Instead, each point on these lines is the average closing price for a certain number of prior candlesticks or periods. As each new closing price is added, the oldest one is dropped from
the calculation, hence the term moving average, or MA for short. For example, a 200-period MA plots the average price over the past 200 periods. The length of each period depends on the time frame of the chart you’re using. That means:
The advantages of MAs over simple trend lines and channels are:
More objective, more reliable insight into what other traders will do. Different traders may plot their simple trend lines and channels differently, but everyone’s MAs look exactly the same for a given time frame and period, because their charting software packages all use the exact same calculations to draw the various types of MAs.
By using MAs, we see the same S/R that everyone else is seeing, so we get better insight into where most traders want to enter and exit positions, and where they are more likely to make money.
That’s a valuable advantage because actually, success in trading is NOT about anticipating what actually happens or is ultimately true, but instead it is all about anticipating other what traders will do and then doing it first, before they:
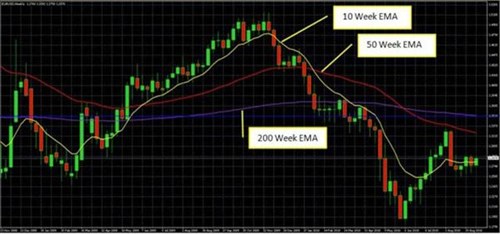
MA’s are better at showing movement and character of trend. They follow the general up and down gyrations of the actual trend and so show a trend’s volatility better than the straight lines of simple trend lines or channels. For example, note how the MAs on this chart move to varying degrees (depending on their duration) with price. Simple or channel trend lines can’t capture that. Notice also how the 200 week EMA (a type of MA discussed below) highlights how despite the gyrations in price, over the duration of the chart, price has in fact changed little.
In addition to S/R, they also show momentum. Although we’re focusing on S/R for now, there are other important areas of technical analysis. One of them is momentum, which is just the rate at which price is changing. Because MAs move up and down with any sustained changes in price, they tell us about momentum as well as S/R. That’s a big advantage over other trend lines because a change in momentum is a leading indicator that often provides clues about future trend strength and direction. Momentum trading is a technique for trading by watching price momentum.
Moving averages plot an average of prior prices, so by their very nature they lag behind price. The more periods that are averaged, the slower the MA responds to recent price changes. For example, note on the chart below how the shorter duration 10 week MA reflects near term price direction better than the 50 and 200 week MAs.

Somewhat more responsive alternatives to current conditions than the standard or simple moving average (SMA) are exponential moving averages (EMAs) and weighted moving averages (WMAs), both of which weigh current prices more heavily than older ones. There is no consensus about which is best, although the SMAs and EMAs are more widely used.
The most widely followed short, medium, and longer term MAs are 5-, 10-, 20-, 50-, 100-, and 200-period MAs. Even the mainstream financial press aimed at laymen will often mention when one or more of the major stock indexes cross its 50- or 200-day MA.
The Forex media will regularly take notice if a major currency pair hits or crosses one of the longer-duration MAs like its 50-, 100-, or 200-day MA. Similarly, because MAs in longer timeframes are older, 20-, 50-, or 200-day, week, and month MAs get more attention because they provide much more significant S/R than those durations in shorter time frames.
That very popularity gives their S/R a degree of self-fulfilling prophecy and so adds to their importance, because the crowd tends to enter and exit around what they think are strong S/R points. Trading is all about anticipating what the crowd will do, doing it first so that you buy low and sell high (or do the opposite when shorting).

We hope you found our site useful and we look forward to helping you again soon!