EUR/JPY Trade
Multiple Time Frame Momentum Strategy Simulations: EUR/JPY Trade
Based on actual trading data from Oct 09, 2014. Using the MTFM strategy on a major JPY cross, we use naked chart analysis to identify a strong S/R zone, and consider dropping down to a lower time frame to try to find a low-risk entry. The MTFM and Signal Candles, and position of support and resistance are considered before seeking an entry before the London open, which is a good time to trade this pair. A price action, trailing stop loss exit strategy is utilized.

EUR/JPY Trade
Subjects Covered:
- Multiple Time Frame Momentum Strategy
- Multiple Time Frame Coordination
- Signal Candles
- Time of Day
- Position of Support/Resistance
- Highs and Lows
Signal 1
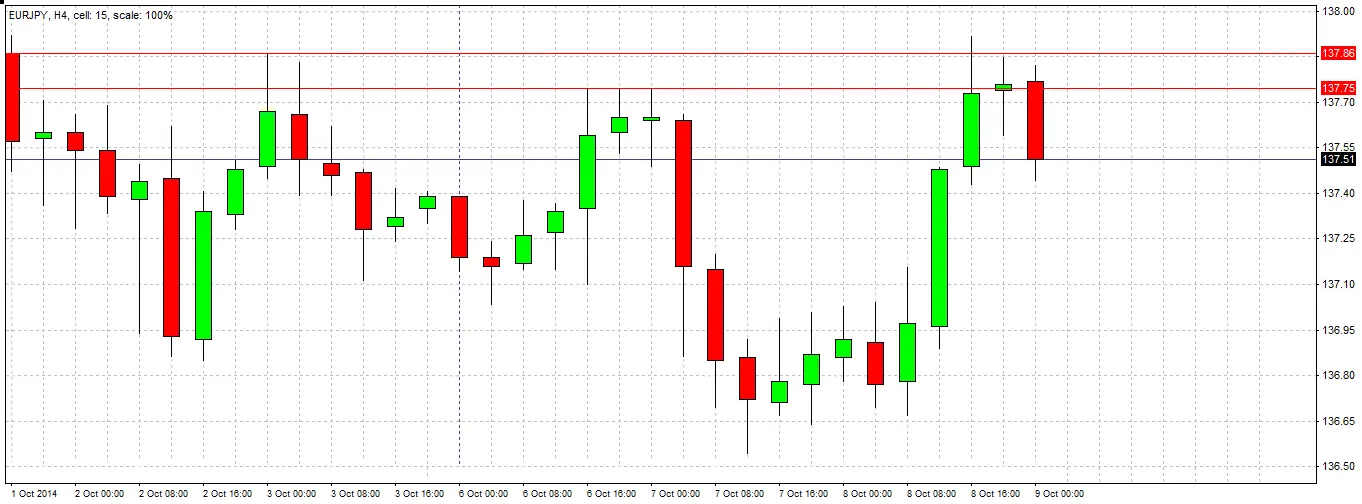
Half-way through the Tokyo session, it can be seen that the EUR/JPY cross has printed on the H4 chart a bearish engulfing candle that closes fairly near to its low. The previous two candles both have wicks rejecting previous daily highs (see the red horizontal lines). This looks like a good short trade off a resistant area. Additionally, this time of 4am GMT can also be a good time begin trading JPY pairs and crosses, as it is close to the beginning of the day for Europe and the Middle East, as well as overlapping with the second half of the Tokyo session.
We decide to drop down to the M15 time frame to look for a precise entry.
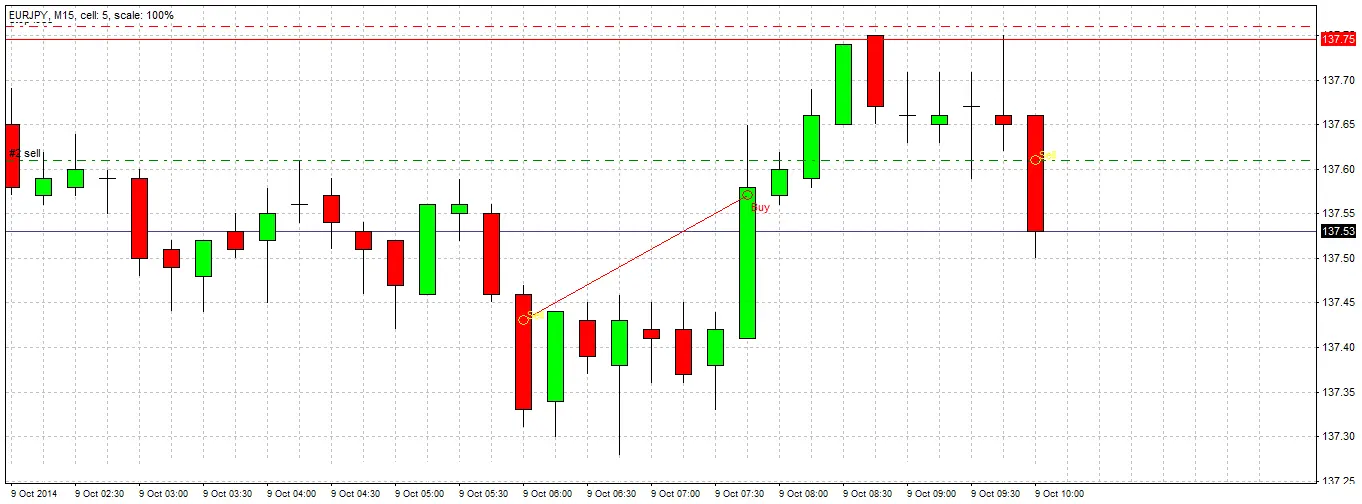
Trade Entry
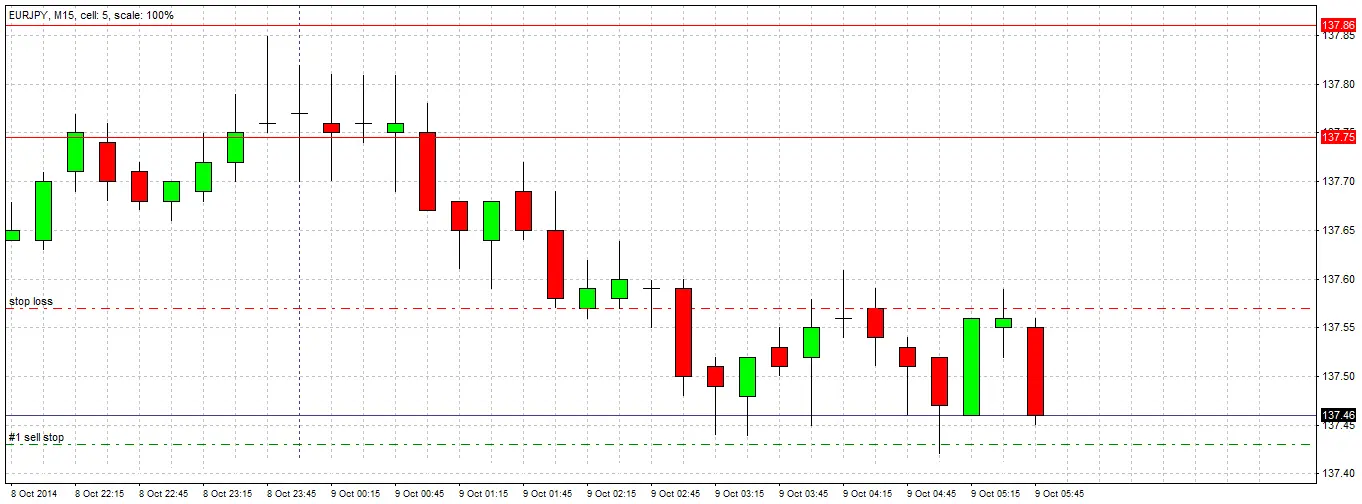
After dropping down to the M15 time frame following the H4 bearish engulfing candle signal, we have to wait two hours before we get a bearish engulfing candle on this time frame as well. It is a not a good sign that we have had to wait so long. We will enter a short trade 1 pip beyond the low of the M15 candle at 137.43, placing our stop loss at 1 pip above the high of the M15 candle at 137.57. Our entry is triggered within the next 15 minutes, as required.
1st Trade Exit
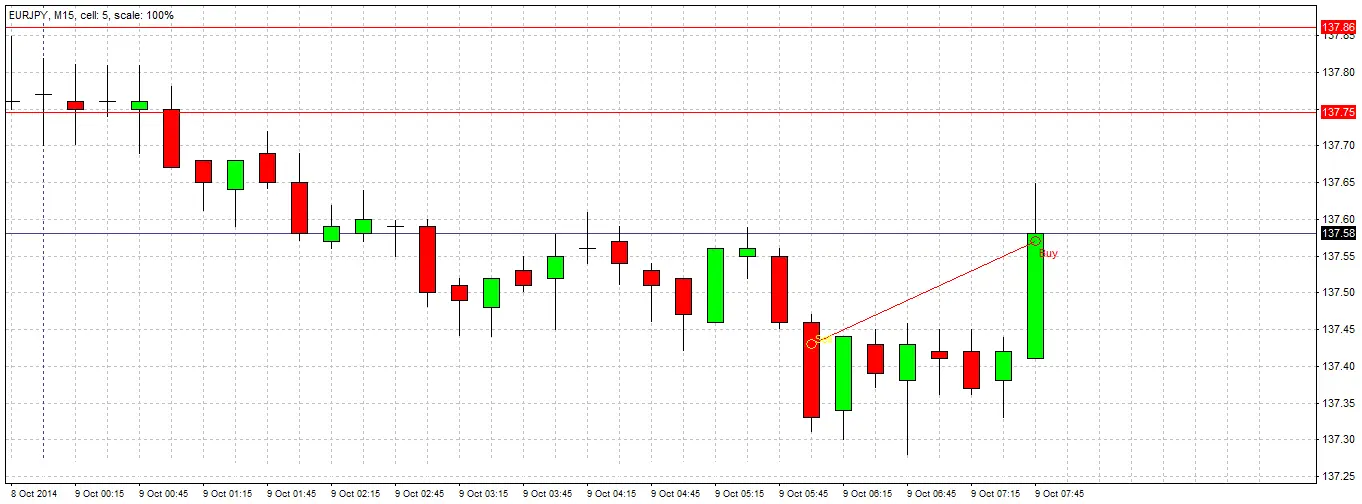
Unfortunately, the trade does not move far into profit, and we are stopped out. However a relatively low success rate is to be expected when trading smaller time frames from larger time frames. We continue to wait for another opportunity to enter.
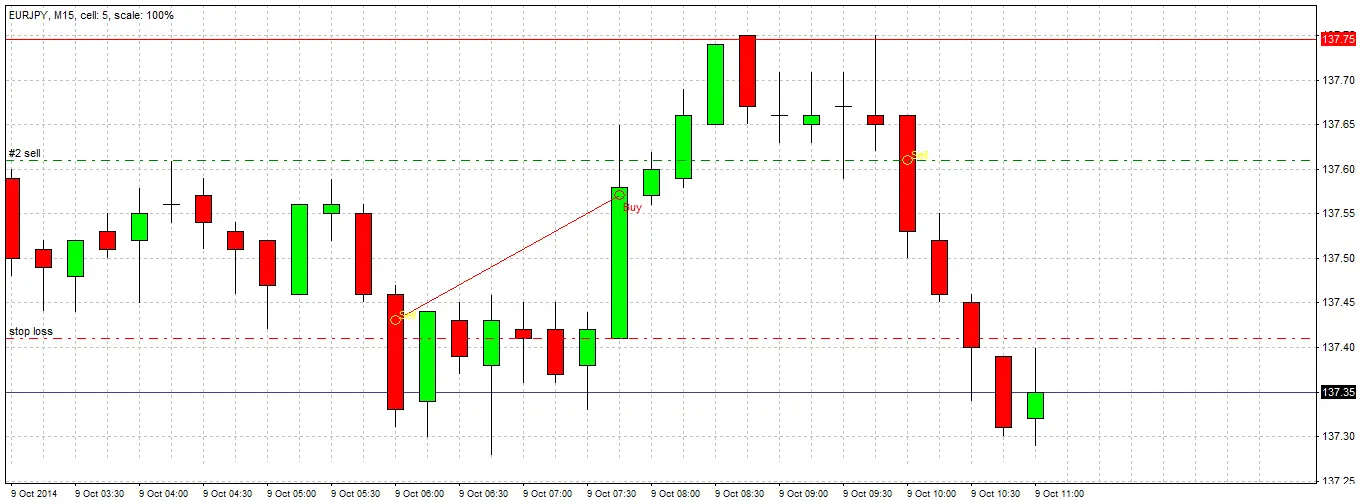
Signal 3
Within the next 2 hours, the price retraces back to the supply zone that we drew from the bearish candlesticks in the H4 chart. After failing to move higher for several candlesticks, a bearish pin bar is formed. This is a new signal to go short 1 pip below the candlestick.
Trade Entry 2
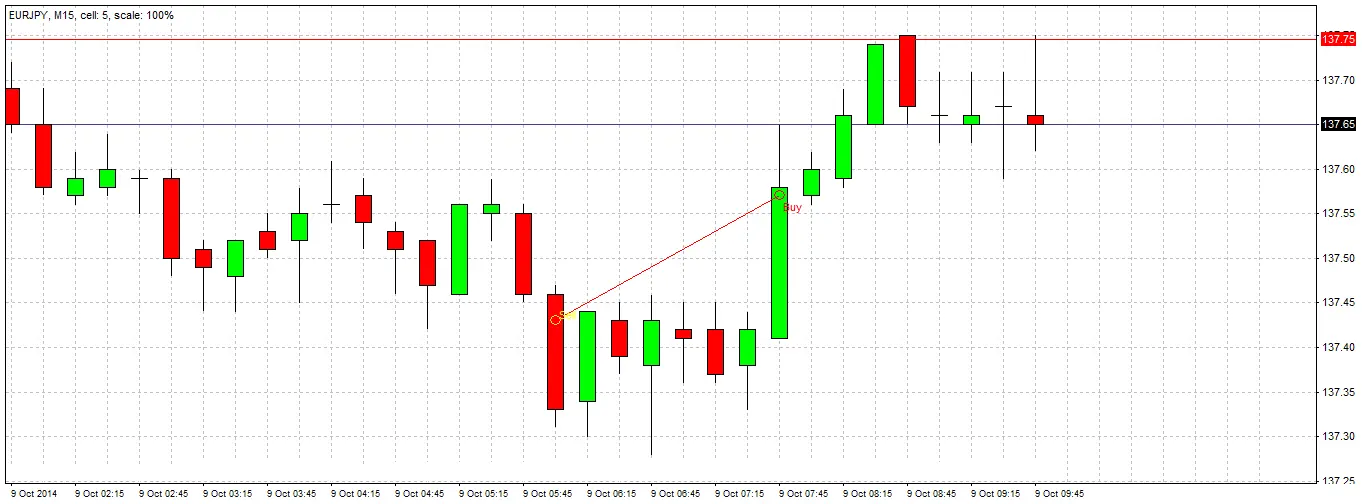
We enter 1 pip below the candlestick at 137.61 with our stop loss 1 pip above the candlestick at 137.76.
We have no defined profit target, but will watch the 15 minute candlesticks for bullish signs that will determine full or partial exit from the trade.
Adjust Stop Loss
A first bullish candle is printed, in an area that was previously supportive.
We decide to raise the stop loss to 1 pip above this bullish candle, at 137.41.
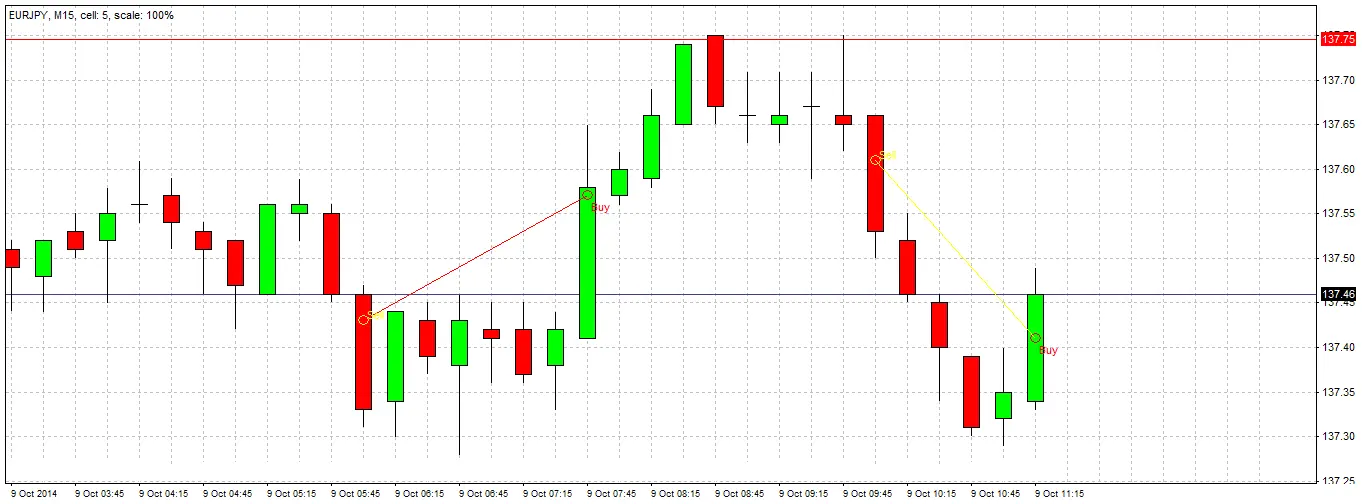
Final Trade Exit
Our stop loss is hit, and we are out of the trade for a profit of 20 pips.
We lost 15 pips on our first entry, so our overall profit is 5 pips.
When trading smaller time frames, it is wise to be persistent, as a successful 2nd or 3rd entry will often pay for the initial losing trade(s), and also provide some profit.
