AUD/USD Trade
Multiple Time Frame Momentum Strategy Simulations: AUD/USD Trade
Based on actual trading data from Feb 24, 2014. Using the MTFM strategy on a minor USD pair, we use naked chart analysis to identify a strong S/R zone, and consider dropping down to a lower time frame to try to find a low-risk entry. The MTFM and Signal Candles, and position of support and resistance are considered before seeking an entry at the London open, which is a good time to trade this pair. Different exit strategies are considered, and finally compared for their relative profits and losses.

AUD/USD Trade
Subjects Covered:
- Multiple Time Frame Momentum Strategy
- Multiple Time Frame Coordination
- Signal Candles
- Time of Day
- Position of Support/Resistance
- Highs and Lows
Signal 1
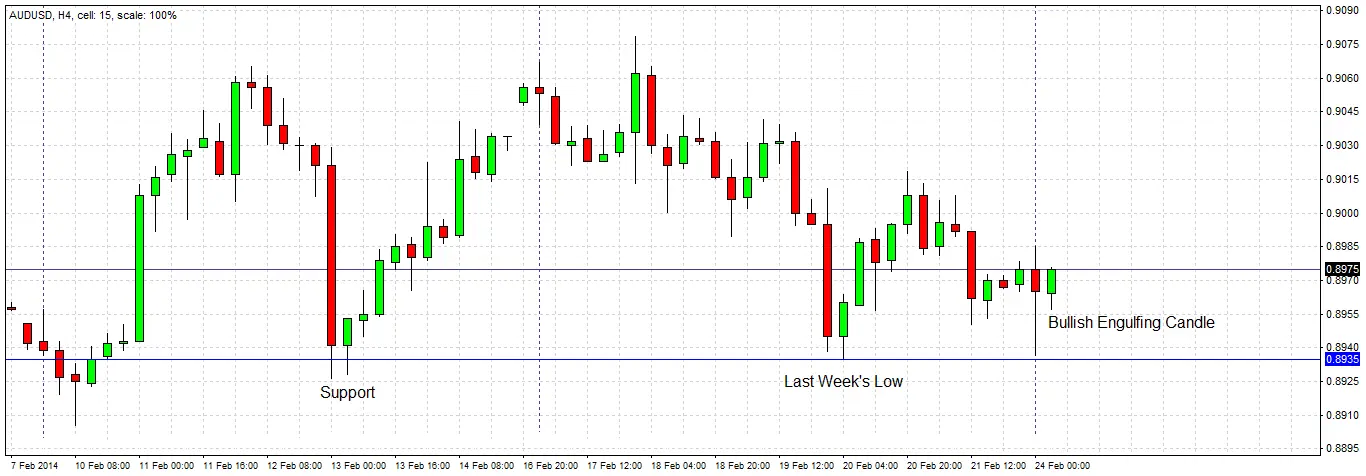
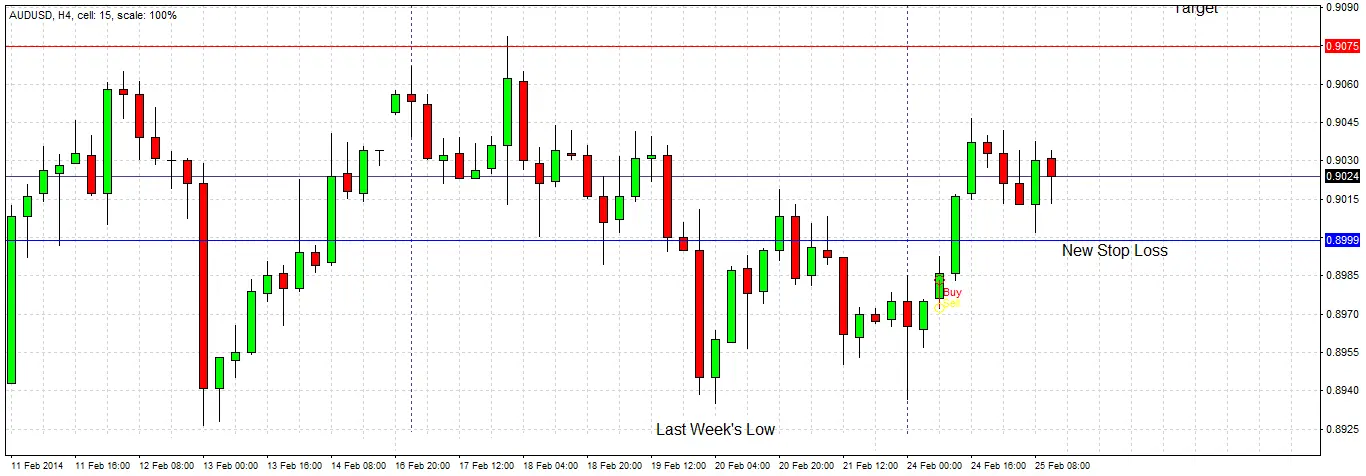
As the London session opens, it can be seen that the AUD/USD pair has printed on the H4 chart a bullish engulfing candle that closes very near to its high. The previous candle came within 1 pip of rejecting the previous week’s low of 0.8935, and the rejection is a strong one. This looks like a good long trade at a significant double bottom, although the Forex market is quiet and there is no news due that is expected to affect this pair significantly.
We decide to drop down to the M15 time frame to look for a precise entry.
Signal 2
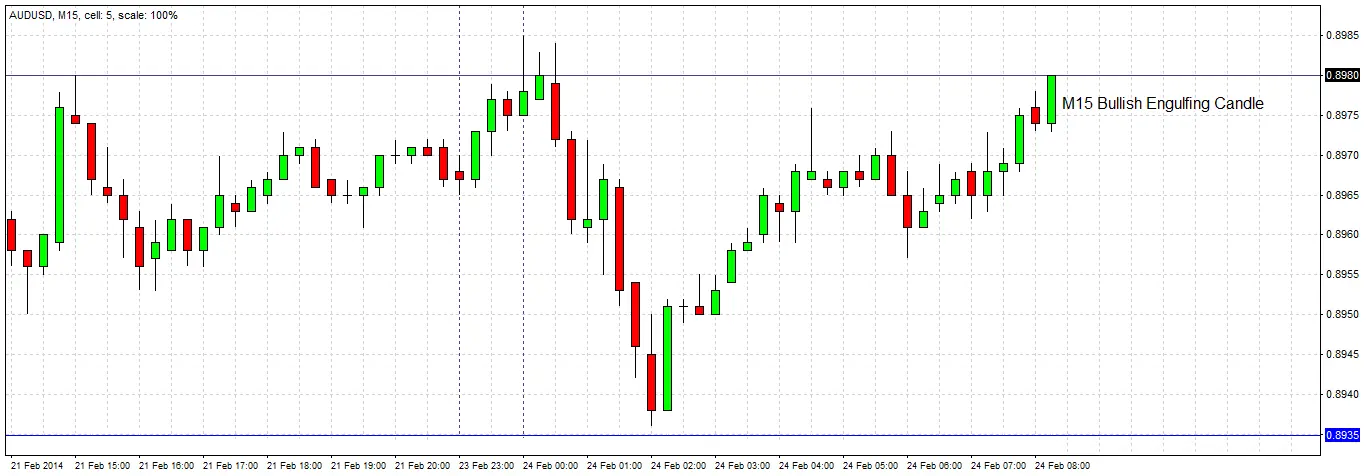
After dropping down to the M15 time frame following the H4 bullish engulfing candle signal, we have to wait only half an hour before we get a bullish engulfing candle on this time frame as well, also closing right at its high. It is a good sign that we have already broken the high of the H4 engulfing candle. We will enter a long trade 1 pip beyond the high of the M15 candle at 0.8981, placing our stop loss at pip below the low of the M15 candle at 0.8972. We will only enter within the next 15 minutes, to ensure we enter with momentum, or not at all.
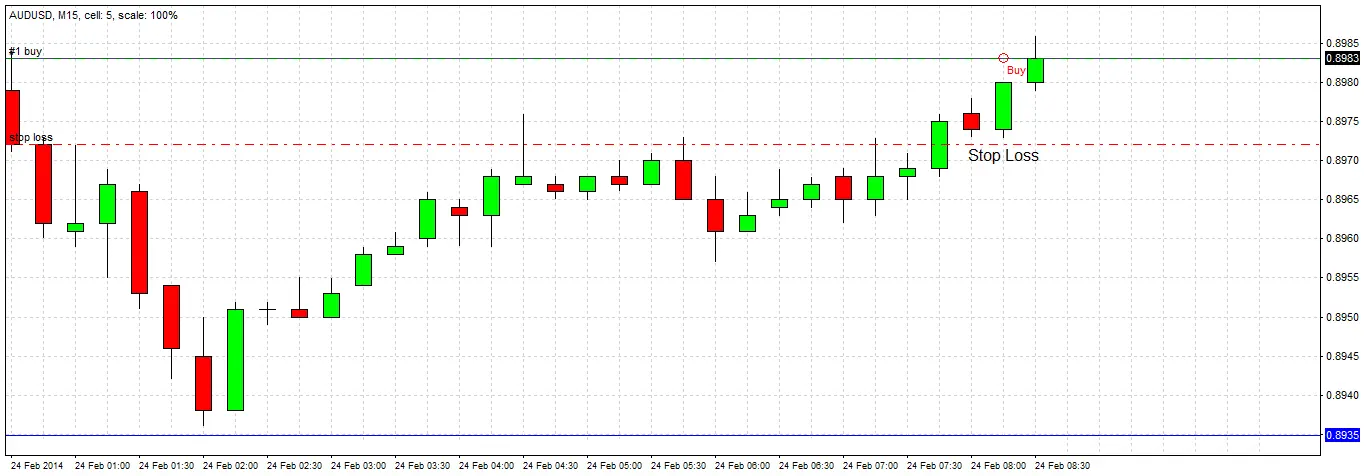
Entry
Our entry is triggered within the next few minutes. We now need to consider at least an initial profit target.
Profit Target
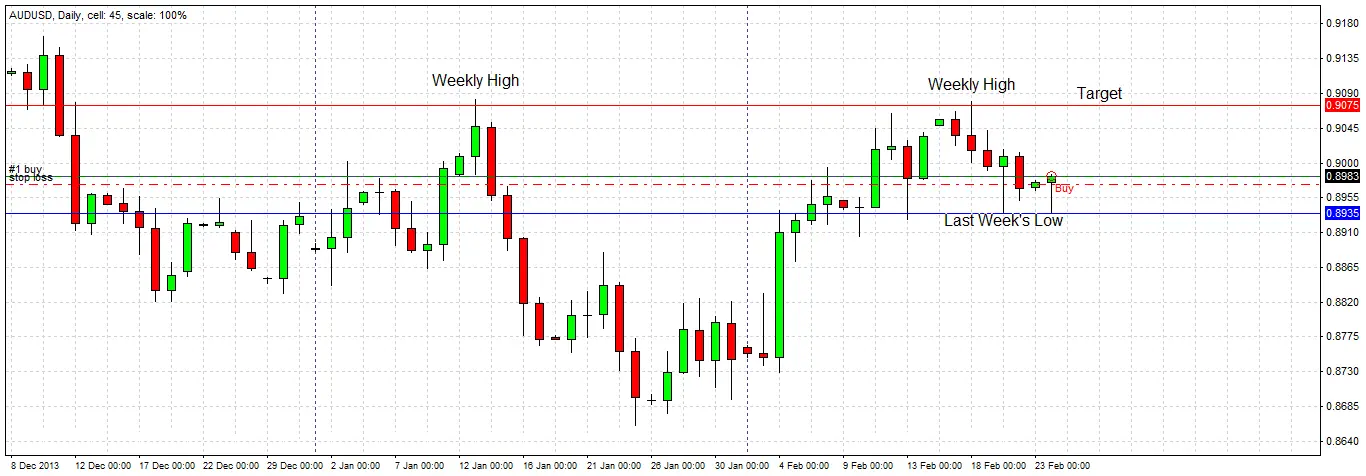
We need to determine a profit target at which we will exit the trade. Looking at a long-term chart, we can see that there is a major double top consisting of two weekly highs overhead at about 0.9075. This pair has been very weak for a long time, so unless we want to try for a very long odds pay off, we should exit most of the trade at this number.
We decide to exit the trade completely at 0.9075, but review the progress of the trade periodically to determine an earlier exit if necessary.
Trade Management
After more than a day of being in the trade, we note that the H4 chart is suggesting that now may be a good time to think about taking profit. After rising quite strongly, the price fell and ranged somewhat before printing another bullish engulfing candle earlier today.
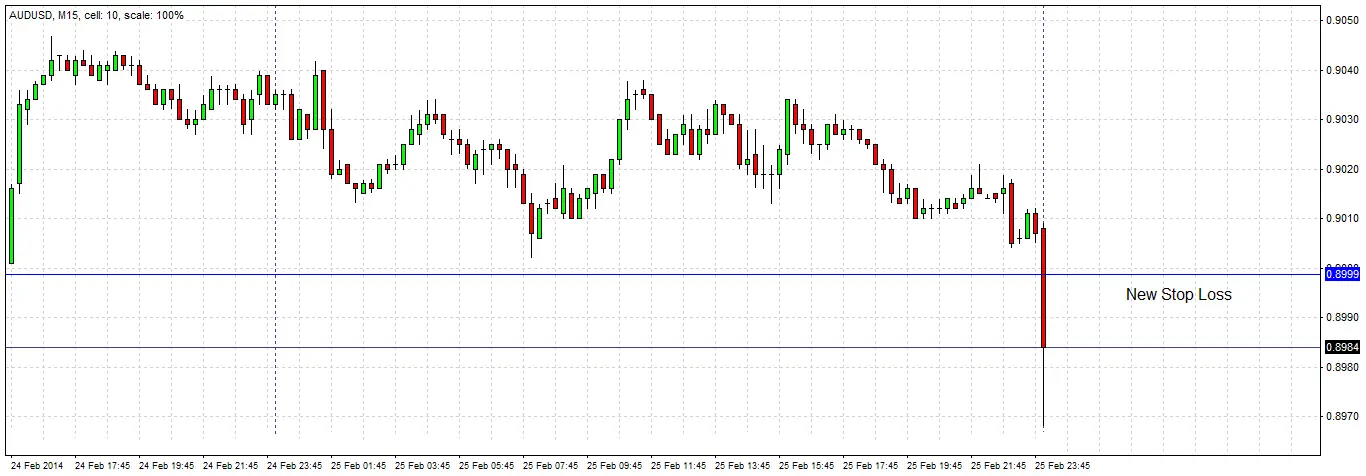
However, the high of that candle held, and the next candle printed was a bearish candle, sigalling we are probably not going to break the high. Therefore we decide to raise the stop loss to just under the low of that bullish engulfing candle. We actually use the round number just a few pips below it, so our stop loss is now 0.8999.
Trade Exit
We are stopped out of the trade for a final profit of 16 pips. As our initial risk was 19 pips, we finished with a profit of almost 1 unit of risk.
Sometimes when it is clear that a trade with a relatively conservative profit target is not continuing with momentum, it can be a good idea to let some kind of trailing stop decide how much profit to be satisfied with. In this case we used an alternative, which was to tighten our stop loss.
It is always a bad idea to widen a stop loss. If stop losses are moved, they should only be tightened.
