USD/JPY Trade
Intraday Pin Bar Strategy Simulations: USD/JPY Trade
Based on actual trading data from August 08, 2014. Using the Daily Pin Bar Strategy on a major currency pair, we enter a long-term trade on an interday basis. The Daily Pin bar signal, position of support and resistance, and issues of stop loss placement are considered before entry. The trade is given a potentially unlimited ultimate profit target with an eventual partial exit, and is open for over one month, so the issues of profit expectancies, trade management, and the quality of S/R and price action are dealt with.

USD/JPY Trade
Subjects Covered:
- Interday Trading
- Signal Candles
- Position of Support/Resistance
- Quality of Support/Resistance
- Trade Management
- Profit Targets
- Stop Loss

Signal 1
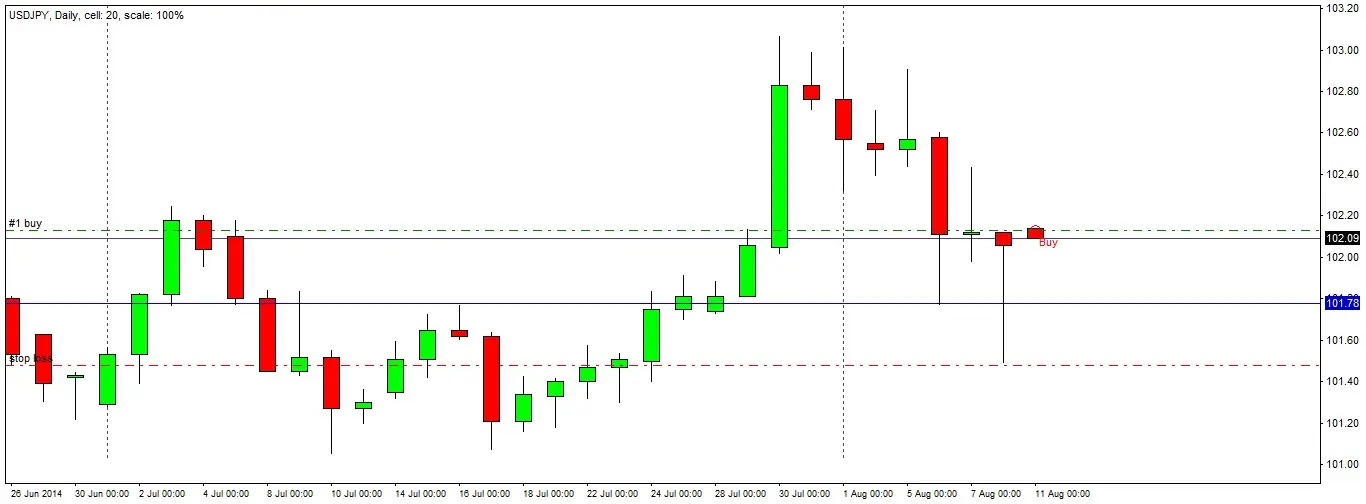
The daily candle closes, printing a pin bar. The candle has a long lower wick, a bearish close, and both closes and opens very close to its high, within its upper quartile range. A pin candle like this on the daily chart is quite rare, and always deserves further investigation, so we take a closer look.
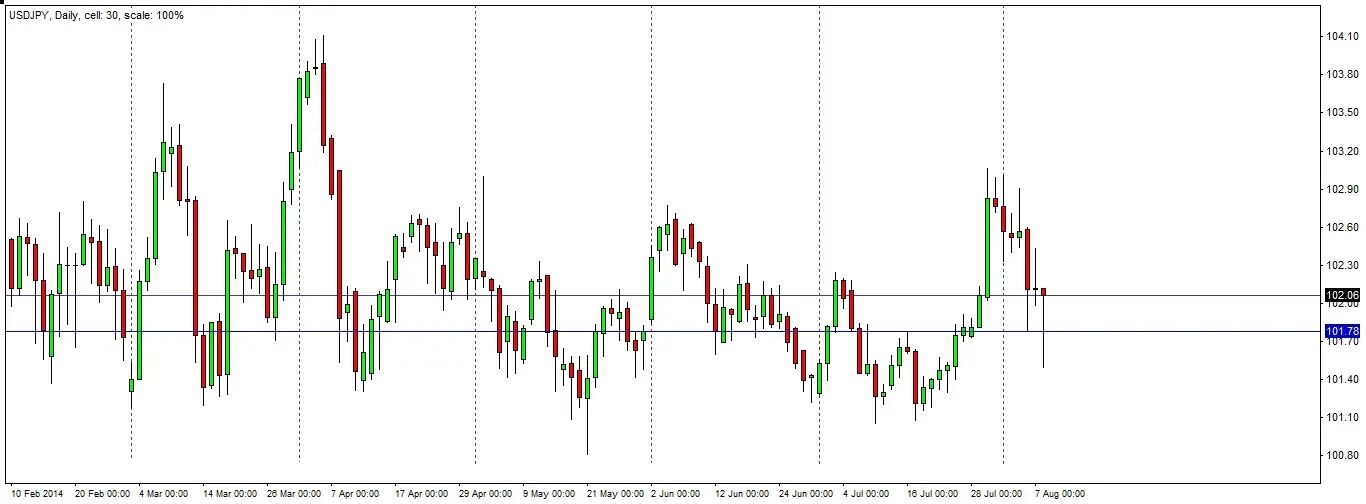
Checking S/R
The first and most important thing to check is whether the pin bar is rejecting any S/R zones. Zooming out of the chart to take a long-term perspective, we can see that the wick of this candle penetrates a “flipped” S/R level confluent with a round number at 101.78. It was established as a swing high during July, and then acted as support 2 days ago. However it is concerning that all the price action visible has been chopping around within a range. Let’s look at some minor factors next.
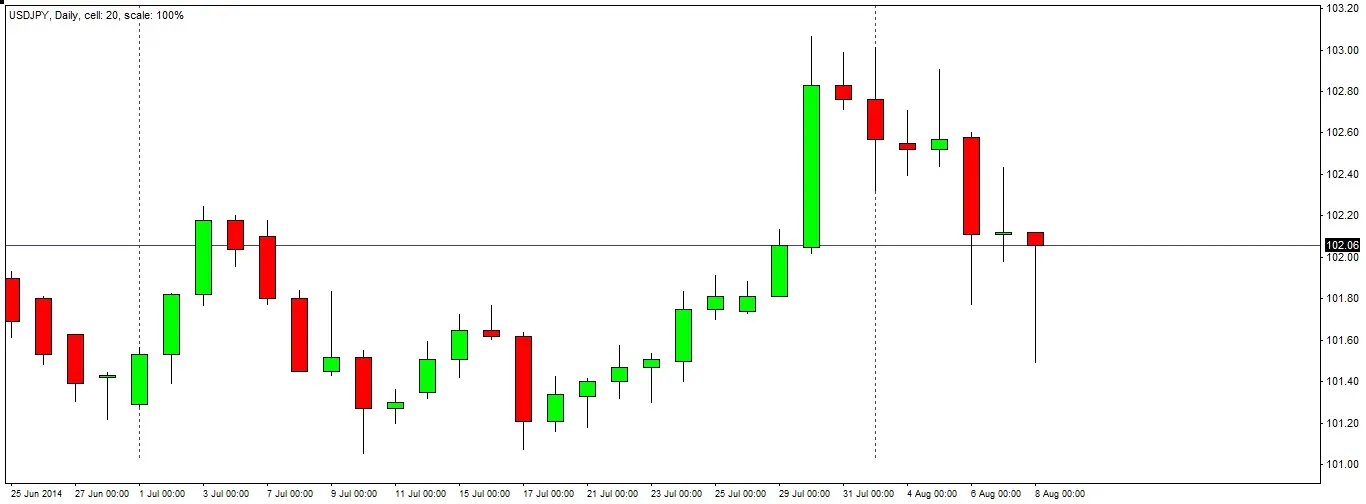
Checking the Signal Candle
A good rule to apply to pin bars is checking whether they have larger ranges than any of the previous 5 candles. Here, we can see that it does not, although its range is relatively large. A good sign that is plainly visible is that the previous daily candle was an inside candle, and the pin bar/inside bar combination tends to be a good price action signal. Finally, let’s have a look inside the daily pin bar by dropping down to a lower time frame over the last 24 hours.
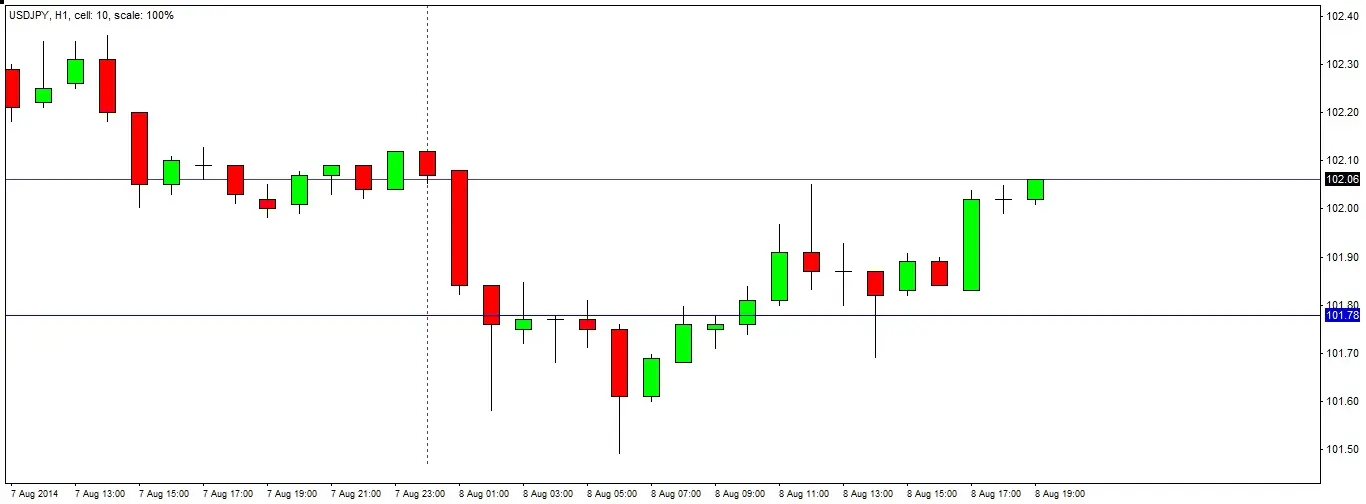
Inside the Daily Candle
Looking at the hourly chart, we see there was nothing really special about the day’s price action. There were two moves down, then two moves up. The buying looks fairly healthy, but there is nothing spectacular, and no real obvious support level to use as a tighter stop loss.
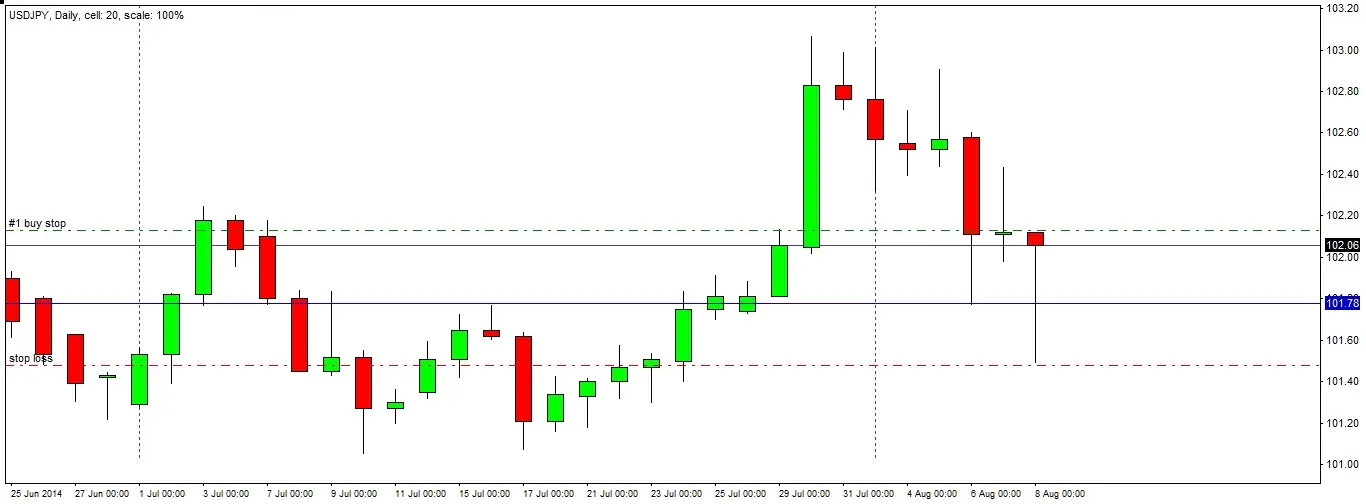
Trade Decision & Stop Loss
A typical entry would be just above the high of the daily pin bar, if it is reached within the next 24 market hours. This is close by so it makes sense to use this as an entry level. The stop loss is typically placed just underneath the low of the daily pin bar. We will place our stop loss there.
Entry
Our entry is triggered very soon after the market opens the following Sunday evening, at our intended entry level. Time of day of entry is not really important when trading large daily candles. As we are trading from the daily time frame, we need to be patient with the trade and give it room to breathe. We should forget about the trade for a couple of days at least.
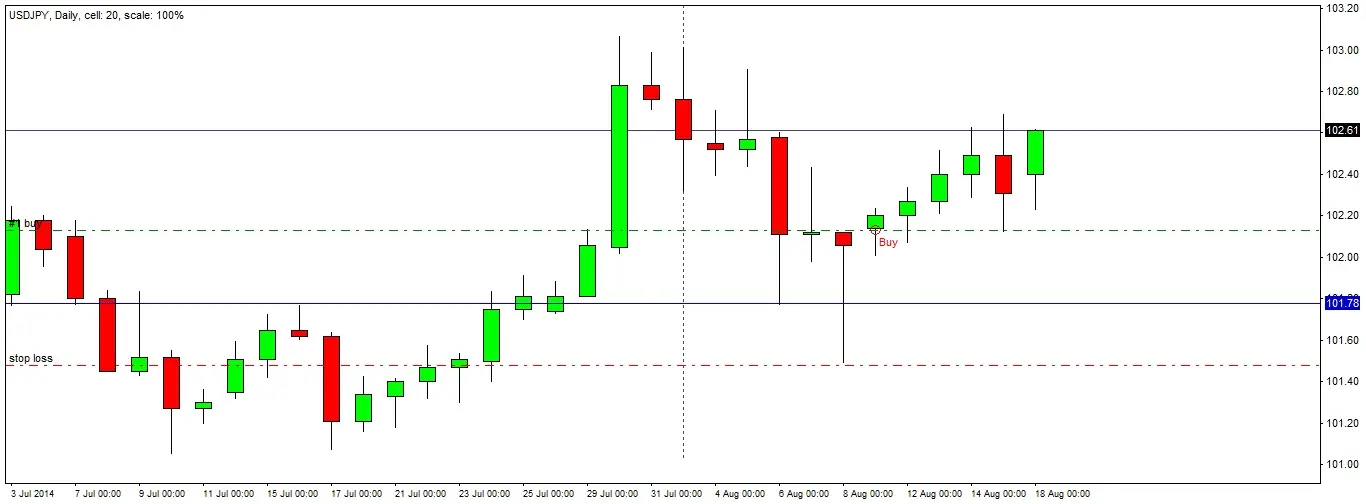
Trade Progress 1
Six days later, the trade has progressed quite well. The steady bullishness seems to stall yesterday with a bearish candle that came back to our entry price, but the price came back today which is a good sign.
We should now wait and watch to see how the price reacts if and when it reaches the previous major swing high at around 103.00, which is also a round number.

Trade Progress 2
Twenty days after entry, the trade continues to progress well. The price broke strongly through the expected resistance at 103.00.
The price is printing an inside bearish candle and failing to rise above the next expected resistance level of 104.00, so this would be a good time to take at least partial profits. the trade is in profit by a reward to risk ratio of about 3 to 1.
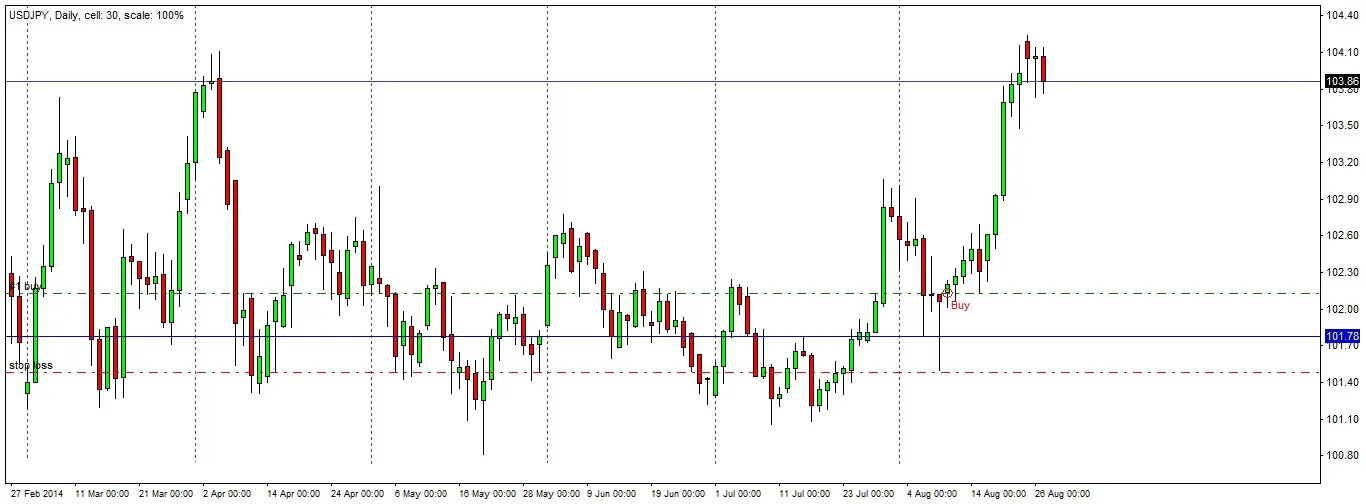
Exit 1
We decide to exit from half of the position, booking a profit of 1.5 units of risk, and hope that the trade ultimately continues to rise.
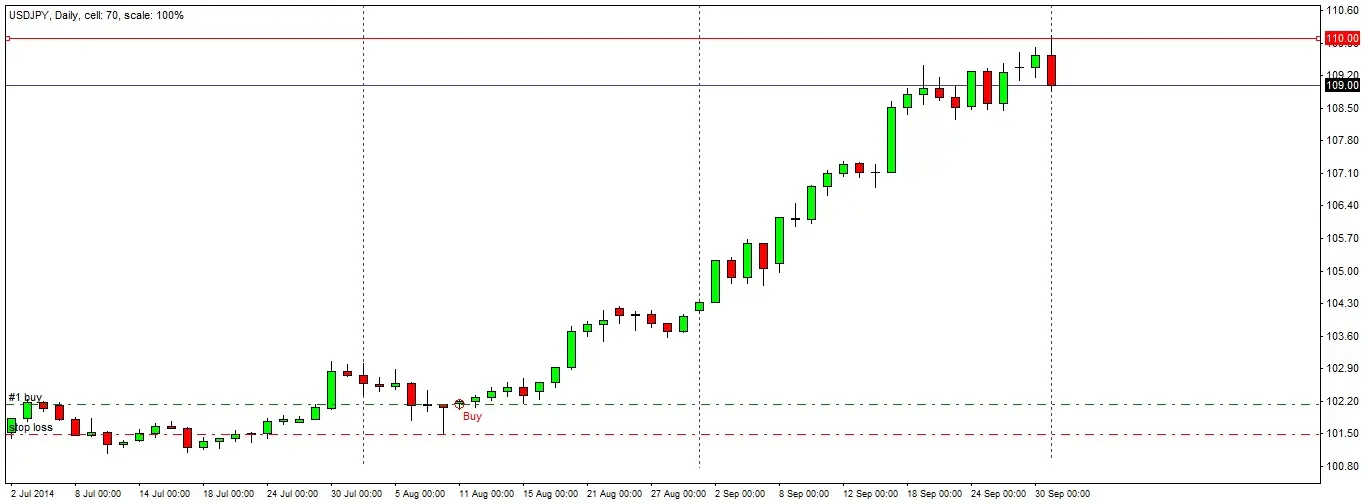
Final Exit
The price continues to rise strongly, giving an excellent profit. We decide to exit from the remainder of the trade after the close of a strongly bearish daily candle rejecting the key psychological level of 110.00. This is very powerful momentum but it has to pause somewhere.
This trade gives an idea of the power of ensuring you let winners run by waiting for negative price action to take you out of the trade.
