GBP/USD Trade
Intraday Pin Bar Strategy Simulations: GBP/USD Trade
Based on actual trading data from Jan 03, 2013. Using the Daily Pin Bar Strategy on a major currency pair, we enter a long-term trade on an interday basis. The Daily Pin bar signal, position of support and resistance, and especially issues of stop loss placement are considered before entry. The trade is given a potentially unlimited profit target with two partial exits, and is open for over one month, so the issues of profit expectancies, trade management, and the quality of S/R and price action are dealt with.

GBP/USD Trade
Subjects Covered:
- Interday Trading
- Signal Candles
- Position of Support/Resistance
- Quality of Support/Resistance
- Trade Management
- Profit Targets
- Stop Loss

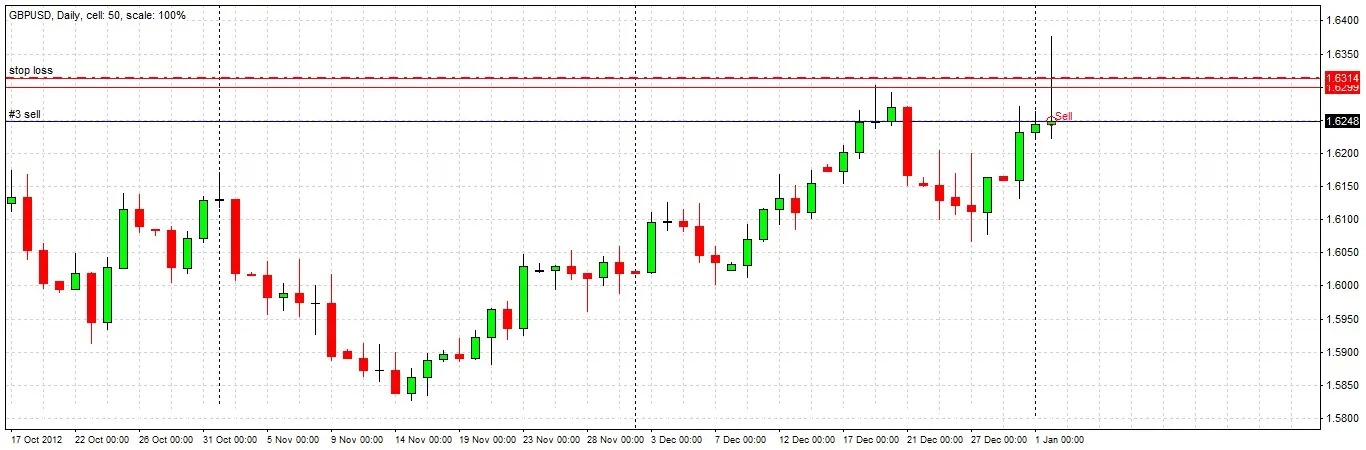
Signal 1
The daily candle closes, printing a pin bar. The candle has a long upper wick, a bearish close, and both closes and opens very close to its low, within its lower quartile range. A pin candle like this on the daily chart is quite rare, and always deserves further investigation, so we take a closer look.

Checking S/R
The first and most important thing to check is whether the pin bar is rejecting any S/R zones. We can see that the wick of this candle penetrates an important S/R zone, forming a triple top. It was established during April 2012 and tested during September, holding both times, giving us positive IRATE criteria. This support is well established and has survived a test. This is a very positive sign, encouraging us to take a short trade. The support level is also confluent with a round number, at 1.6300. Let’s look at some minor factors next.

Checking the Signal Candle
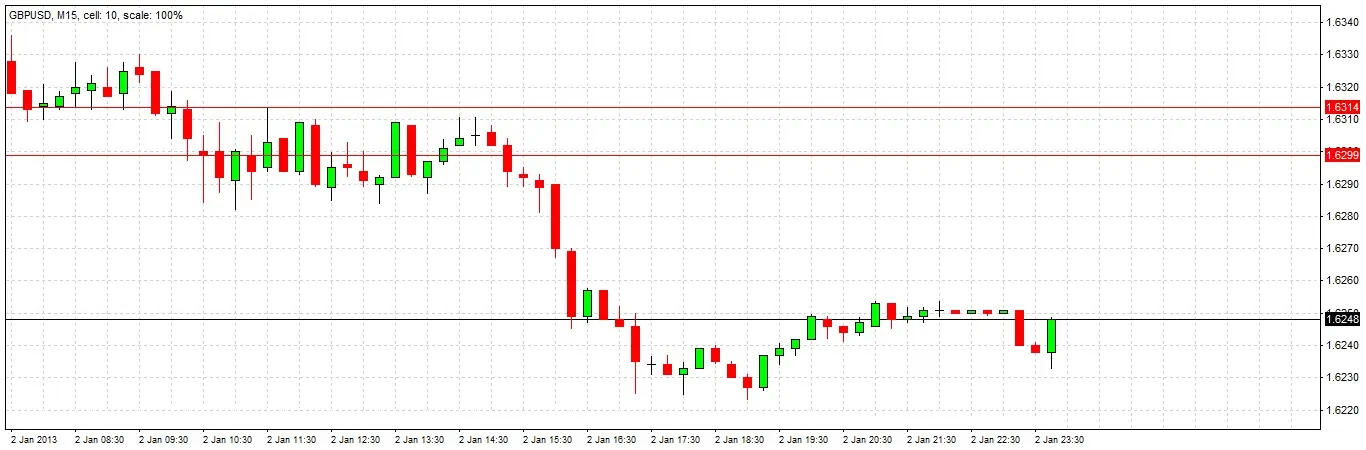
A good rule to apply to pin bars is checking whether they have larger ranges than any of the previous 5 candles. Here, we can see that none of the 5 previous candles was larger. In fact, there has not been a daily candle with a larger range since November. This is a bearish sign. Finally, let’s have a look inside the daily pin bar by dropping down to a lower time frame over the last 24 hours.

Inside the Daily Candle
Looking at the 15 minute chart, we see there was a sharp fall during the New York session, followed by what looks like the beginning of a short-term uptrend. It is reassuring to know that the daily pin bar was not caused by a sudden spike. There are no good reasons not to take this long trade.
Trade Decision & Stop Loss
Clearly, this is a good trade opportunity. A typical entry would be just below the low of the daily pin bar, if it reached within the next 24 hours. This is close by so it might make sense to use this as an entry level, but we really might as well enter at market. The stop loss is typically placed just above the high of the daily pin bar. As this is a large daily candle, this level is a large distance, giving us a large risk in terms of pips. An alternative approach would be to use a tighter stop loss, giving us a lower pip risk. We need to stop and think.

Stop & Think
We need to decide where to place our stop loss. Stop losses are often approached incorrectly by inexperienced traders. The objective of a stop loss is not only to give a trade a good chance of surviving to reach profit, the size of the stop loss can also greatly affect the profitability of a trade. Successfully halving a stop loss, for example, doubles eventual profitability. A trader can be more profitable even by being stopped out more often, as long as the tight stops act to multiply the profitability gained by the winning trades. Let’s consider our options for placing a stop loss in this long trade.

Option 1: Traditional Stop Loss Below Daily Candle
The traditional conservative approach is to place the stop loss just above the high of the daily pin bar. This would give us a risk of 132 pips.

Option 2: Aggressive Stop Loss Above S/R and 50% Retracement of Daily Candle
A more aggressive option is to find a place to put a tighter stop loss. Looking against at the M15 chart, we can see there is natural resistance at the 1.6314 level, which is about 66 pips away. This is also the 50% Fibonacci retracement level of the daily pin bar. This looks like an attractive option for improving our reward to risk ratio.
Option 3: Split the Position into Halves with both Options 1 and 2 Stop Losses
A compromise would be to place a stop loss for half of the position under the low of the daily candle, and the other half just below the 50% retracement level as outlined in Option 2. This gives us an averaged risk of 99 pips.
Stop Loss Decision
We decide to take Option 2, and set our stop loss level accordingly.

Entry
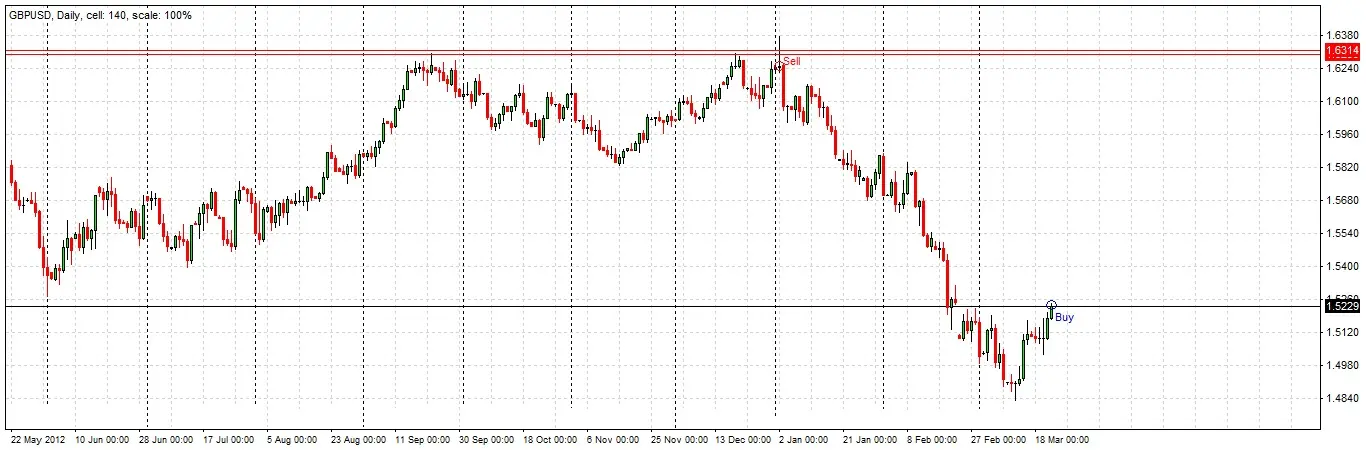
We enter short right away, at the market price of 1.6248.

Exit 1
The trade has gone very well and based upon the price action shown on the daily chart, we do not need to make our first exit until 24 January, when the price seems to be stalling at the swing low from November. We exit half of the position at 1.5827, giving us a realised reward to risk profit ratio of 421 pips divided by our averaged stop loss of 99 pips, which equals 4.25 units of risk.

Final Exit
The price of this pair continues to fall quite sharply. However, during March there are signs that a bottom has been made, with quite strongly bullish candles appearing, and a major higher low is made. When recent swing highs begin to get broken strongly by very bullish candles, this is a strong signal that the major downtrend is over, and the time has arrived for us to exit the remainder of our position. We exit the remaining half of the position at 1.5229, giving us a realised reward to risk profit ratio of 1,019 pips divided by our averaged stop loss of 99 pips, which equals 10.29 units of risk.
Conclusion
The total profit made on this trade was 14.54 times our total risk. We showed patience and made a good profit just by paying attention to some fairly straightforward price action concepts of candlesticks and price behavior around major historical swing highs and lows. Sometimes trading can be very simple.
