AUD/USD Trade Example 2
Intraday Pin Bar Strategy Simulations: AUD/USD Trade Example 2
Based on actual trading data from May 04, 2014. Using the Daily Pin Bar Strategy on a minor currency pair, we enter a long-term trade on an interday basis. The Daily Pin bar signal, position of support and resistance, and especially issues of stop loss placement are considered before entry. The trade is given a potentially unlimited ultimate profit target with an eventual partial exit, and is open for over one month, so the issues of profit expectancies, trade management, and the quality of S/R and price action are dealt with.

AUD/USD Trade Example 2
Subjects Covered:
- Interday Trading
- Signal Candles
- Position of Support/Resistance
- Quality of Support/Resistance
- Trade Management
- Profit Targets
- Stop Loss

Signal 1
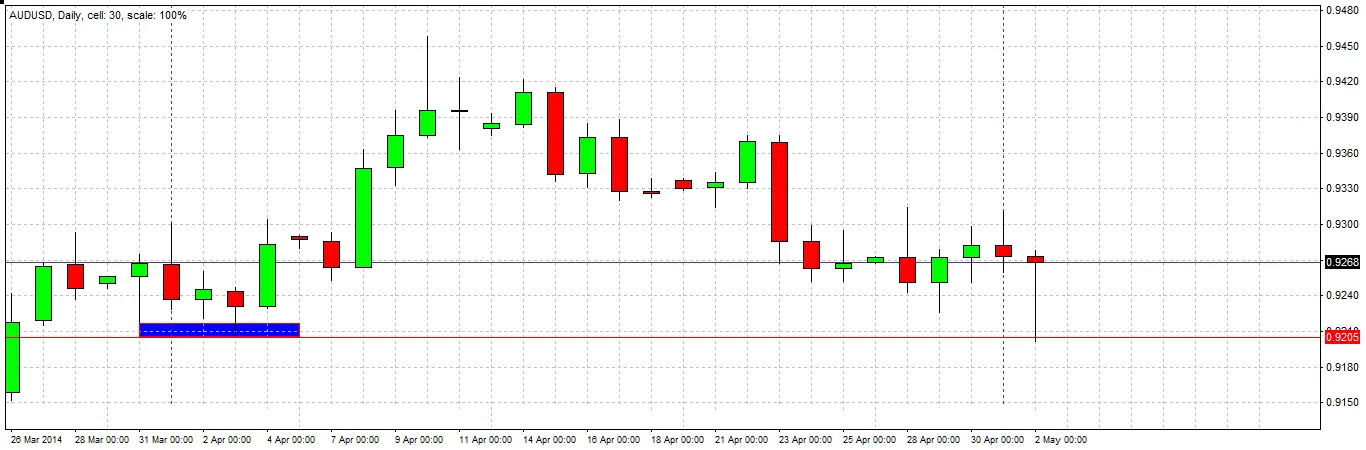
The daily candle closes, printing a pin bar. The candle has a long lower wick, a bullish close, and both closes and opens very close to its high, within its upper quartile range. A pin candle like this on the daily chart is quite rare, and always deserves further investigation, so we take a closer look.
Checking S/R
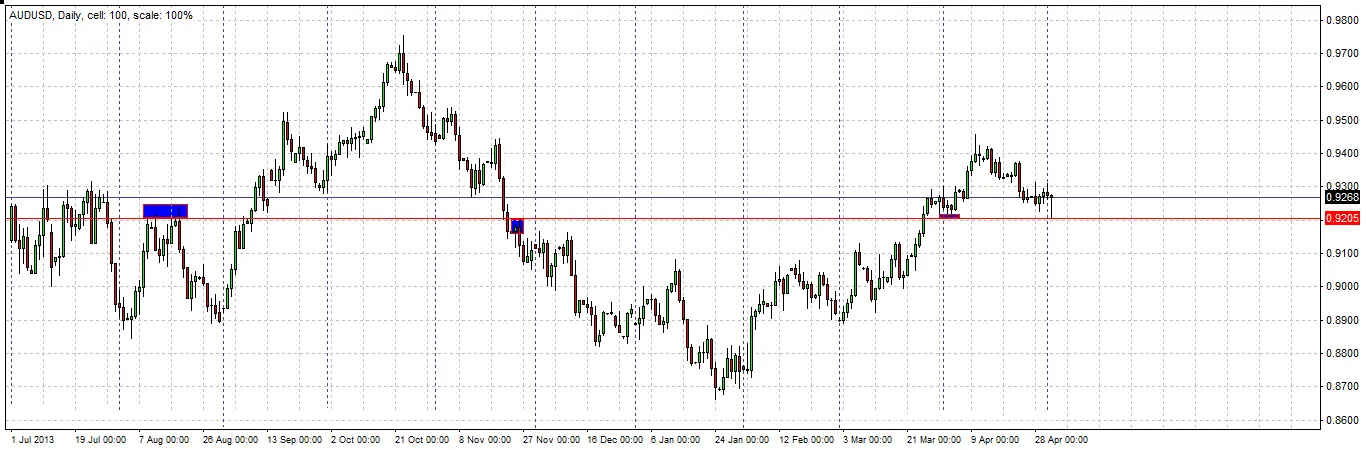
The first and most important thing to check is whether the pin bar is rejecting any S/R zones. Zooming out of the chart to take a long-term perspective, we can see that the wick of this candle just barely penetrates an important “flipped” S/R level confluent with a round number at 0.9200 . It was established as a swing high during November 2013 and then established as a swing low last month after a breakthrough. However it is concerning that so much of the wick is above the level. Let’s look at some minor factors next.
Checking the Signal Candle
A good rule to apply to pin bars is checking whether they have larger ranges than any of the previous 5 candles. Here, we can see that it actually has a larger range than any of the previous 6 daily candles. This is a bullish sign. Finally, let’s have a look inside the daily pin bar by dropping down to a lower time frame over the last 24 hours.
Inside the Daily Candle
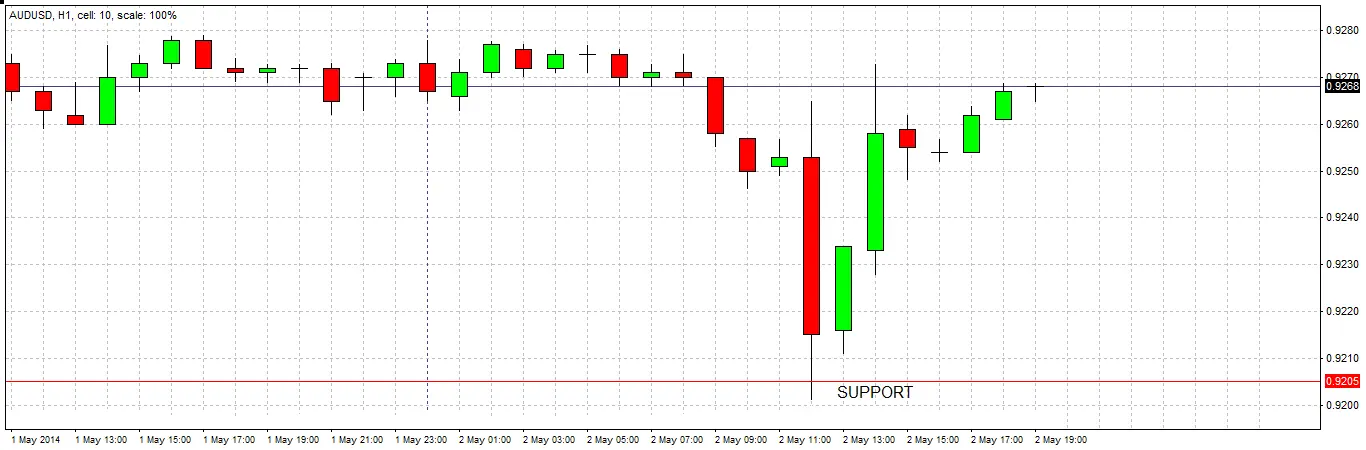
Looking at the hourly chart, we see there was a sudden spike down which rebounded very quickly around the time of the open of the New York session. This is worrying, as it does not show and steady and/or parabolic rise. This trade may be taken, but with caution.

Trade Decision & Stop Loss
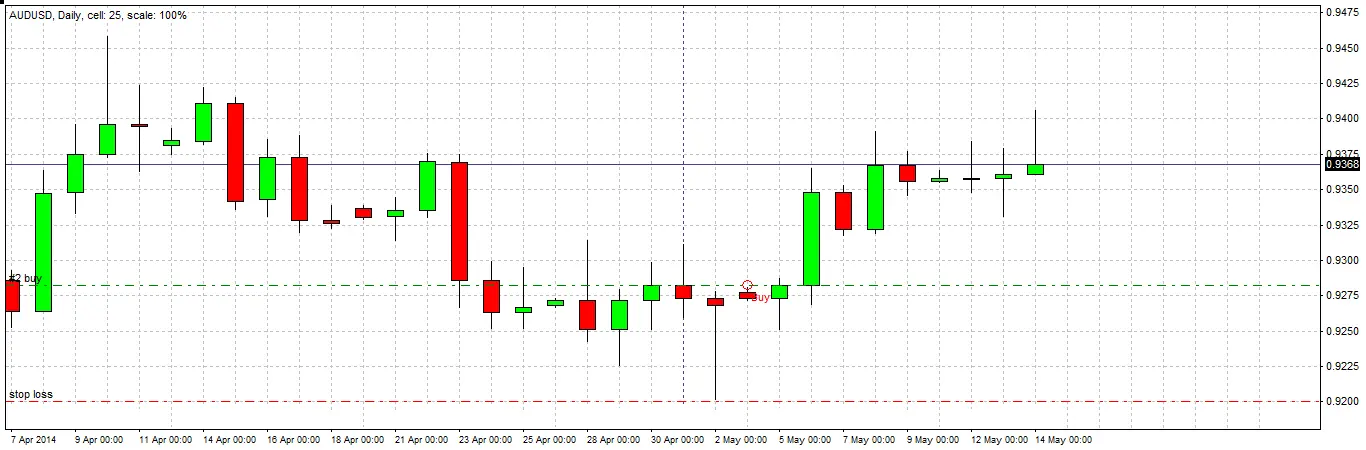
A typical entry would be just above the high of the daily pin bar, if it is reached within the next 24 market hours. This is close by so it makes sense to use this as an entry level. The stop loss is typically placed just underneath the low of the daily pin bar. As there are signs that the true support is only right at the bottom of the daily candle, it makes sense to put our stop loss just below it.

Entry
Our entry is triggered very soon after the market opens the following Sunday evening, at our intended entry level. Time of day of entry is not really important when trading large daily candles. As we are trading from the daily time frame, we need to be patient with the trade and give it room to breathe. We should forget about the trade for a couple of days at least.
Trade Progress
Ten days later, the trade has progressed relatively well, but not very well. The bullishness seems to have stalled at a recent swing high around the 93.80 area. The previous 3 days saw a succession of inside candles (all inside the large mother candle), and today closed as a bearish pin bar. These are all signs that the price is likely to fall now.
Unfortunately, the trade is currently in profit by a reward to risk ratio of only +0.86. This means if we exit now, we will have to take off all or most of the position in order to ensure a total profit.
Another alternative would be to move up the stop loss, but there is no obvious higher swing low on the daily chart that looks like it will hold.
We decide to exit from enough of the position to ensure we break even overall, at worst, and hope that the trade ultimately continues to rise.

Exit 1
We decide to exit from enough of the position to ensure we break even overall, at worst, and hope that the trade ultimately continues to rise.

Bullish Sign
After another month has passed, the trade has survived, despite coming very close to hitting our stop loss. However since that episode, the price has been rising very bullishly, and we have just had a daily close above the bearish trend line. We need to watch and wait.
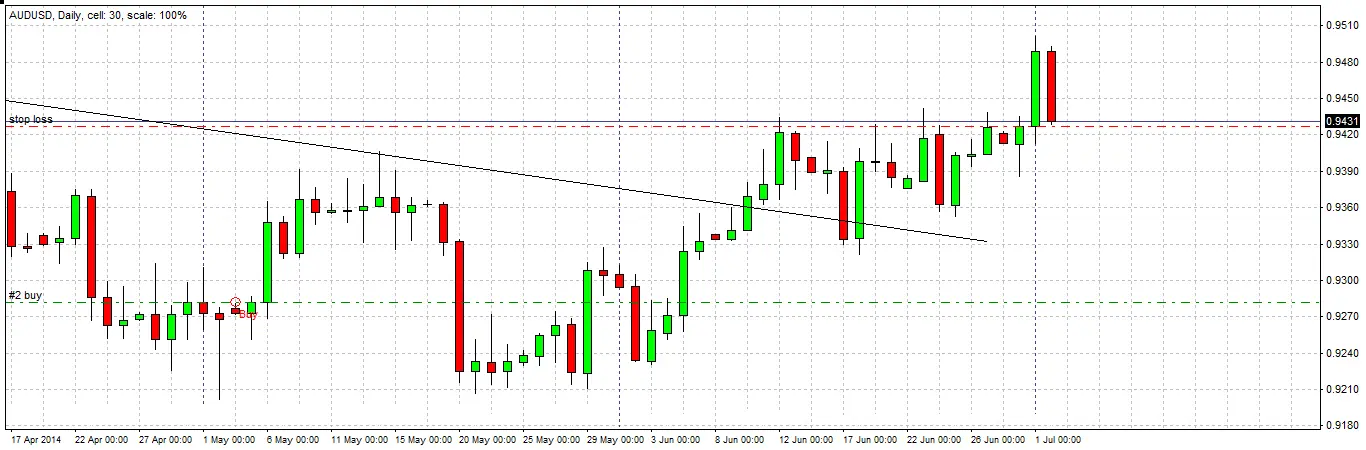
Bearish Sign
More than 2 weeks later after fairly slow progress, the price makes a new multi-month high, but falls very sharply the next day. We decide that after such slow progress, although the total reward to risk ratio is low, it is time to prepare for exiting the remainder of the trade. We move the stop loss to just under the low of today’s candle.

Final Exit
The very next day, we are stopped out. The trade was open for quite a long time and achieved little profit, but we still did achieve an overall profit of 1.37 units of risk.

Conclusion
2 weeks later, our by now hypothetical original stop loss has still not been hit. If we had not exited, we would still be in the trade, but at a lower amount of floating profit. Therefore we still do not know if we made the correct decision to exit. However, when a pair is ranging for a long time, it is probably a good idea to focus on putting your risk somewhere else.
