AUD/USD Trade
Intraday Pin Bar Strategy Simulations: AUD/USD Trade
Based on actual trading data from Mar 05, 2013. Using the Daily Pin Bar Strategy on a minor currency pair, we enter a long-term trade on an interday basis. The Daily Pin bar signal, position of support and resistance, and especially issues of stop loss placement are considered before entry. The trade is given a wide ultimate profit target with two partial exits, and is open for over one month, so the issues of profit expectancies, trade management, and the quality of S/R and price action are dealt with.

AUD/USD Trade Example 1
Subjects Covered:
- Interday Trading
- Signal Candles
- Position of Support/Resistance
- Quality of Support/Resistance
- News
- Trade Management
- Profit Targets
- Stop Loss
Signal 1
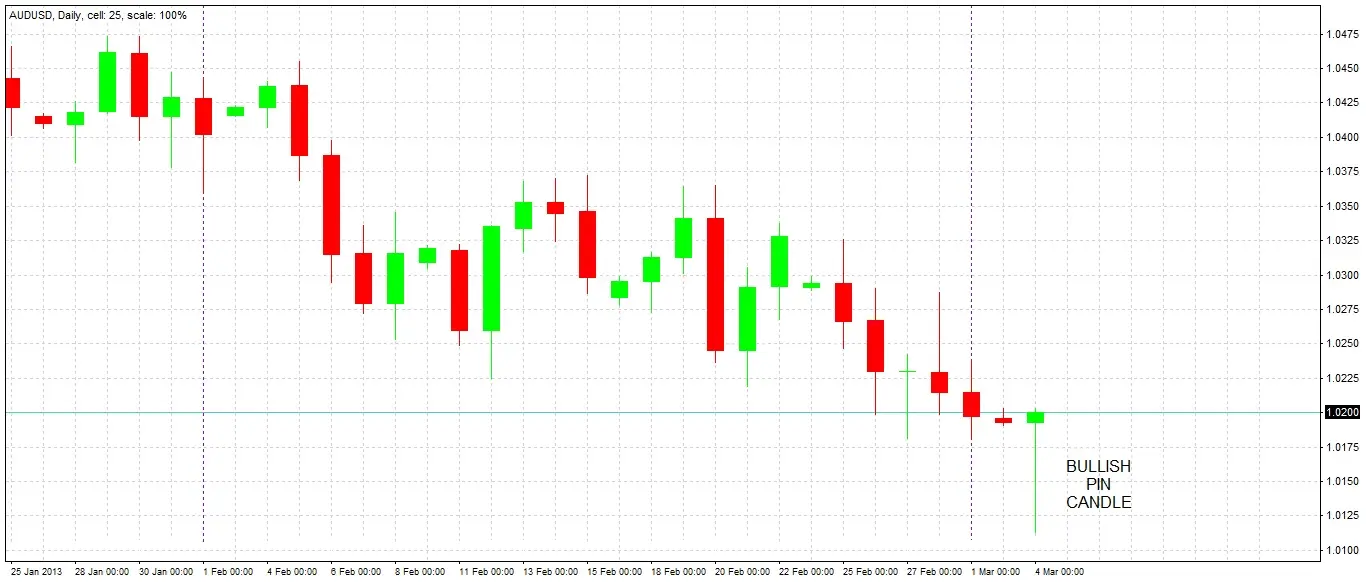
The daily candle closes, printing a pin bar. The candle has a long lower wick, a bullish close, and both closes and opens very close to its high, within its upper quartile range. A pin candle like this on the daily chart is quite rare, and always deserves further investigation, so we take a closer look.
Checking S/R
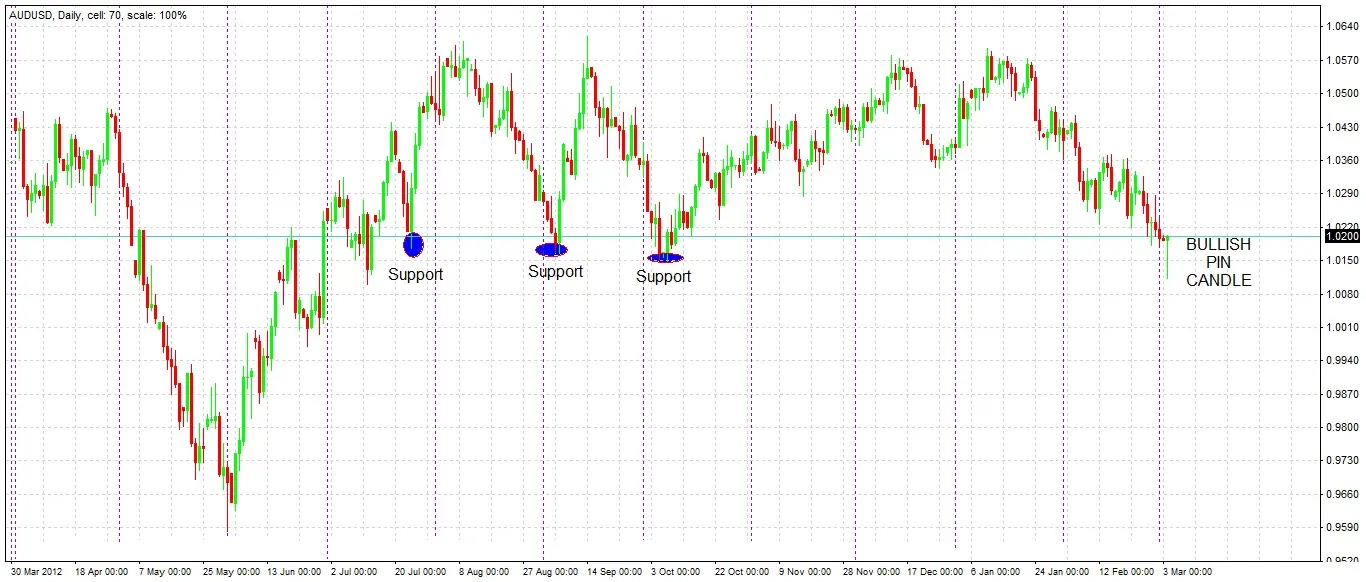
The first and most important thing to check is whether the pin bar is rejecting any S/R zones. Zooming out of the chart to take a long-term perspective, we can see that the wick of this candle penetrates an important S/R zone. It was established during July 2012 and tested twice over the past 7 months, holding both times, giving us positive IRATE criteria. This support is well established and has survived multiple tests. This is a very positive sign, encouraging us to take a long trade. The support zone stretches from about 1.02 to 1.01. Let’s look at some minor factors next.
Checking the Signal Candle
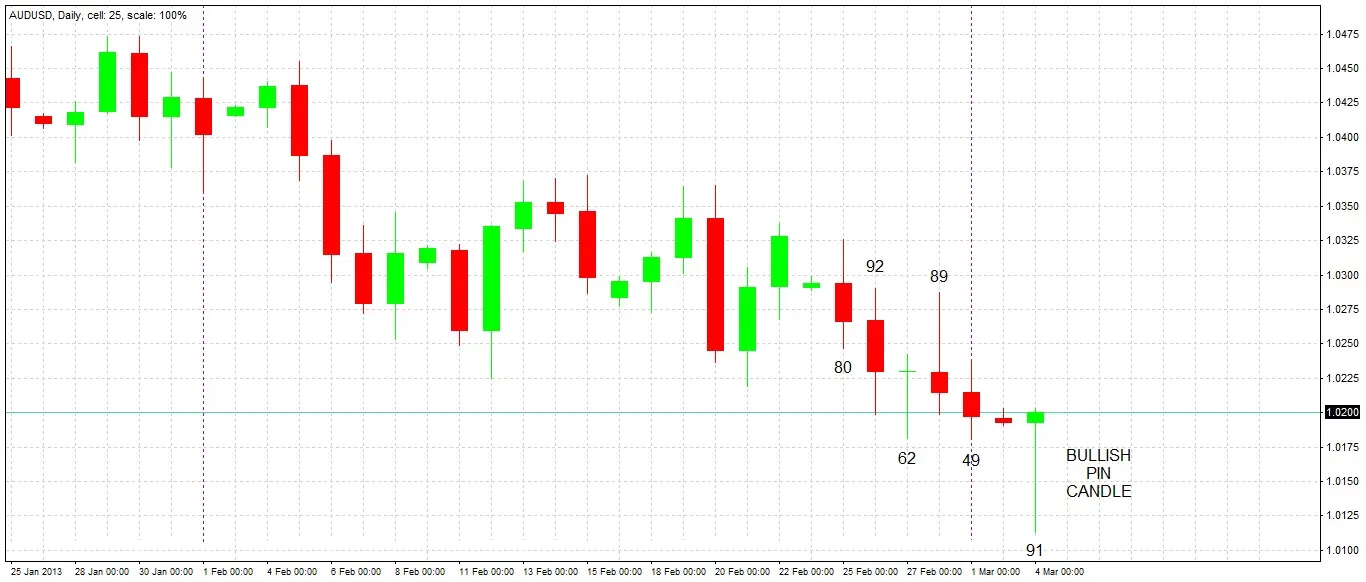
A good rule to apply to pin bars is checking whether they have larger ranges than any of the previous 5 candles. Here, we can see that one of the 5 previous candles was larger, but only by 1 pip, which we can ignore (the candle just before the pin bar was Sunday night’s candle, so that can be discarded). This is a bullish sign. Finally, let’s have a look inside the daily pin bar by dropping down to a lower time frame over the last 24 hours.
Inside the Daily Candle
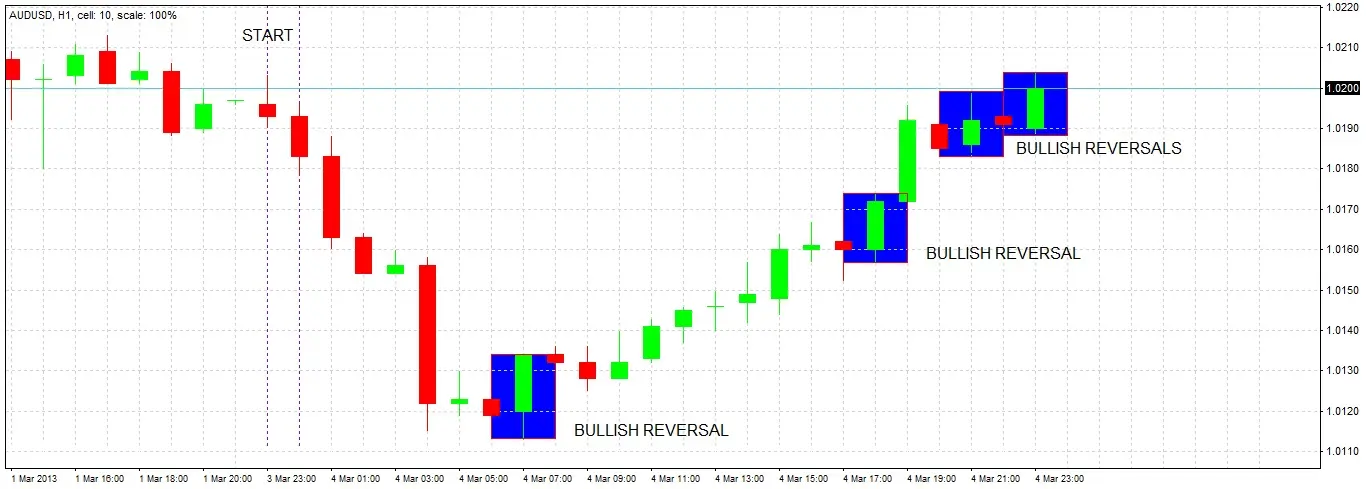
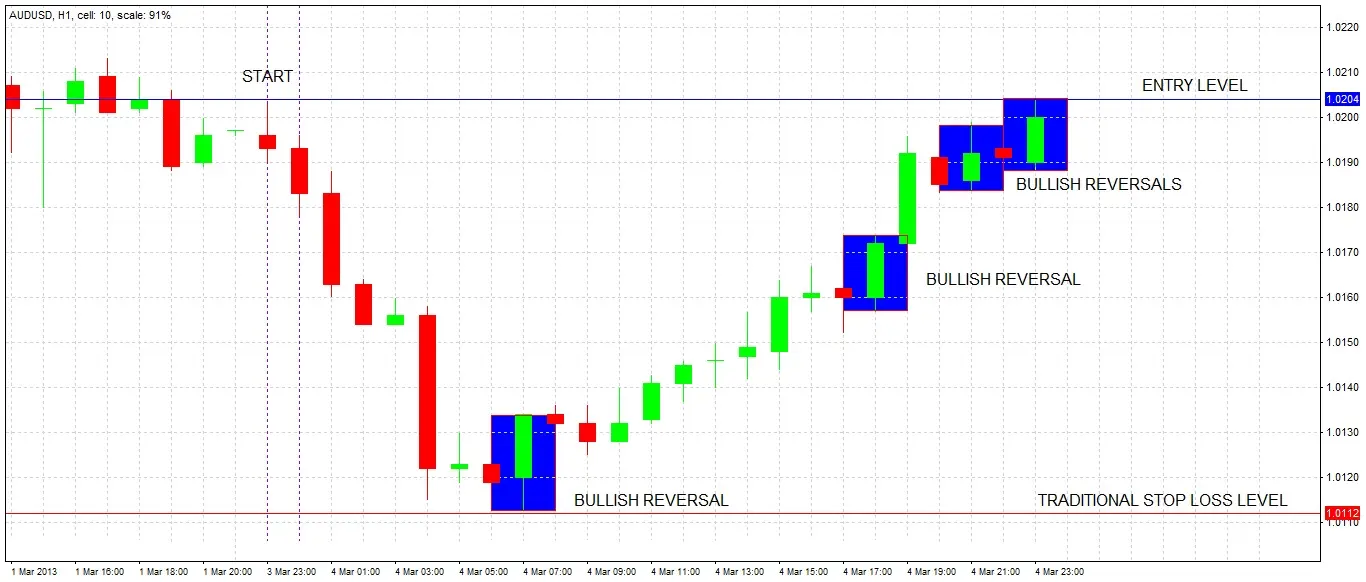
Looking at the hourly chart, we see there was a sharp fall during the Tokyo session, followed by strong and steady buying. It is reassuring to know that the daily pin bar was not caused by a sudden spike. During the steady buying there were several bullish reversal candles, overwhelming most of the few bearish candles. There are no good reasons not to take this long trade.
Trade Decision & Stop Loss
Clearly this is a good trade opportunity. A typical entry would be just above the high of the daily pin bar, if it reached within the next 24 hours. This is close by so it makes sense to use this as an entry level. The stop loss is typically placed just underneath the low of the daily pin bar (TRADITIONAL STOP LOSS LEVEL). As this is a large daily candle, this level is a large distance, giving us a large risk in terms of pips. An alternative approach would be to use a tighter stop loss, giving us a lower pip risk. We need to stop and think.

Stop & Think
We need to decide where to place our stop loss. Stop losses are often approached incorrectly by inexperienced traders. The objective of a stop loss is not only to give a trade a good chance of surviving to reach profit, the size of the stop loss can also greatly affect the profitability of a trade. Successfully halving a stop loss, for example, doubles eventual profitability. A trader can be more profitable even by being stopped out more often, as long as the tight stops act to multiply the profitability gained by the winning trades. Let’s consider our options for placing a stop loss in this long trade.
Option 1: Traditional Stop Loss Below Daily Candle
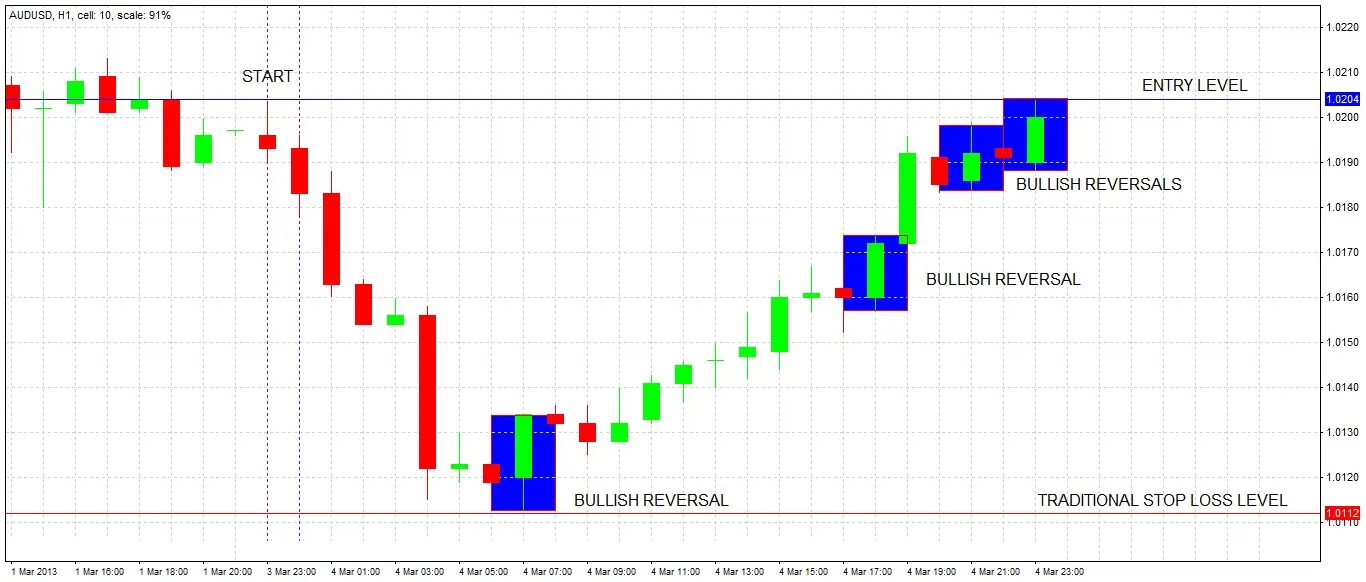
The traditional conservative approach is to place the stop loss just below the low of the daily pin bar. This would give us a risk of 93 pips.

Option 2: Aggressive Stop Loss Below S/R and 50% Retracement of Daily Candle
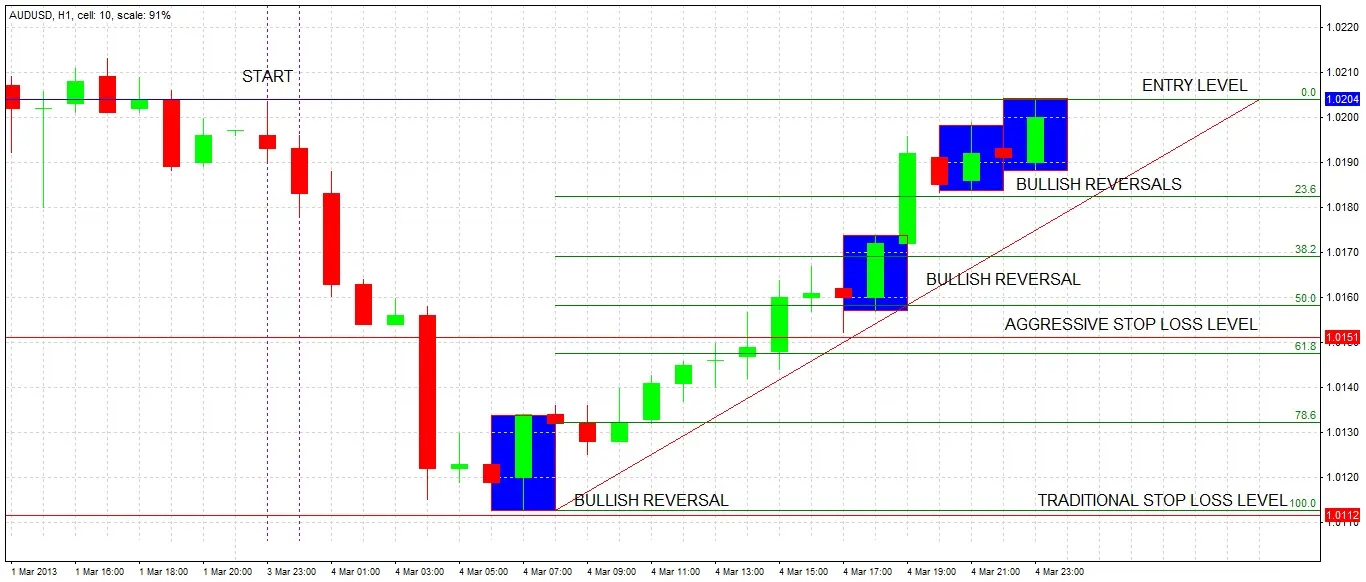
A more aggressive option is to find a place to put a tighter stop loss. The 50% Fibonacci retracement level of a pin bar often acts as S/R. There is a 1 hour bullish reversal candle at around that 50% level. By placing the stop just below this swing low at 1.0152, we would have a risk of 54 pips, considerably less than the conservative option. As good trades often take off quickly with little retracement, using tighter stops may decrease the win rate less than it increases overall profitability.

Option 3: Split the Position into Halves with both Options 1 and 2 Stop Losses
A compromise would be to place a stop loss for half of the position under the low of the daily candle, and the other half just below the 50% retracement level as outlined in Option 2. This gives us an averaged risk of 73.5 pips.
Stop Loss Decision
We decide to take Option 3, and set our entry and stop loss levels. We now wait to see if our entry is triggered during the next 24 hours. If it is not, we will not enter the trade, as it would indicate a lack of bullish momentum.

Entry
Our entry is triggered a few minutes later. Each half of the position has a different stop loss. Time of day of entry is not really important when trading large daily candles. As we are trading from the daily time frame, we need to be patient with the trade and give it room to breathe. We should forget about the trade for a couple of days.
Trade Progress
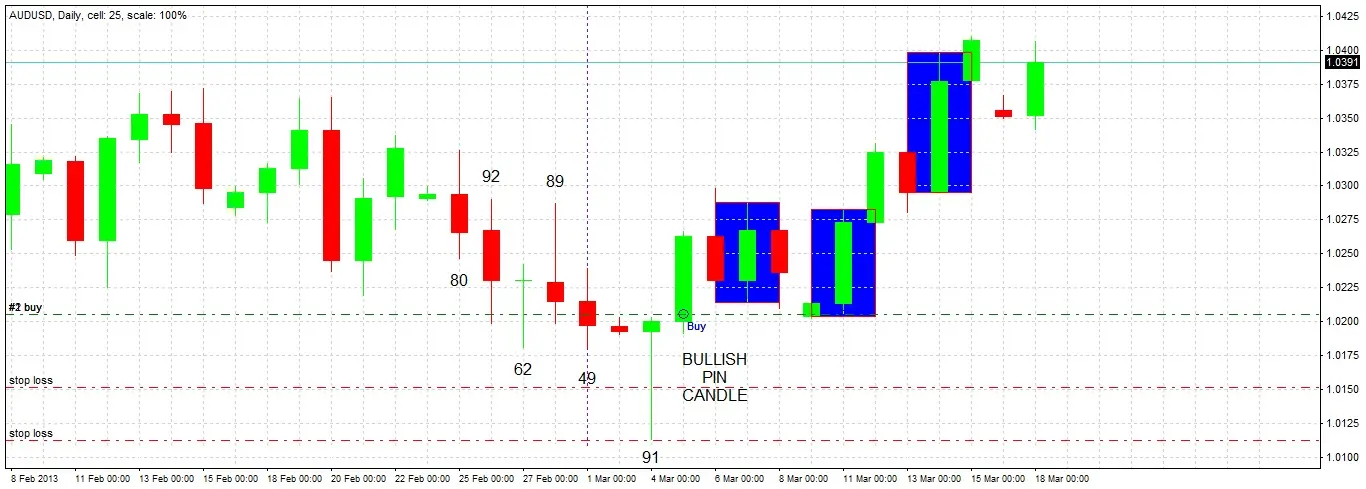
Two weeks later, the trade has progressed well. It retested the entry level after a few days, but we remained calm and that paid off. Neither our aggressive nor conservative stops were hit, so the full position has survived and is currently in profit at a reward to risk ratio of +2.55. Note the three daily bullish engulfing candles highlighted in blue. We need to think about an exit strategy and consider the position of resistance overhead.

Exit Strategy
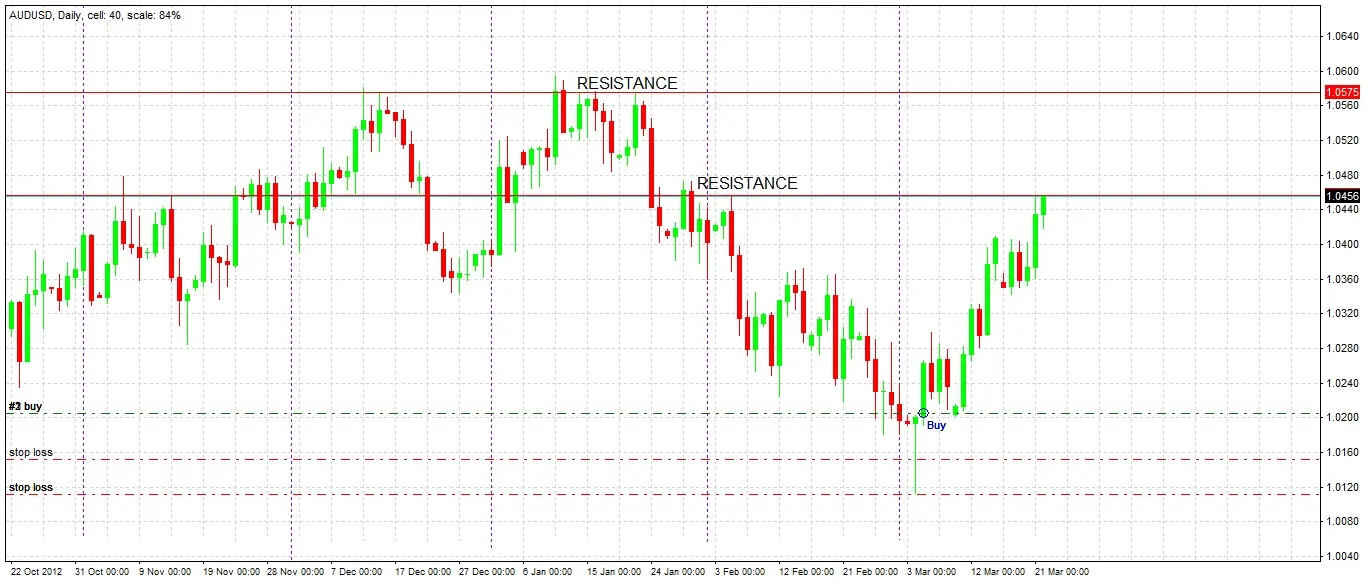
Looking at the daily chart, we see important resistance levels overhead at previous swing highs, at 1.0456 and 1.0575. The price has not been beyond 1.0596 for a very long time. Therefore we decide to take half of the position as profit at 1.0456, and a quarter at 1.0575, leaving the remaining quarter to run. We will monitor the price action at these levels carefully and be prepared to amend our targets accordingy.
Exit 1
Our first profit target of 1.0456 is hit. We exit half the position as planned and continue to monitor the trade. We have taken profit of +1.72 units of risk, and have more unrealized profit in the trade. We will monitor the trade more frequently and carefully now as it has hit one of the identified resistance levels, so it might turn against us.
Bearish Sign
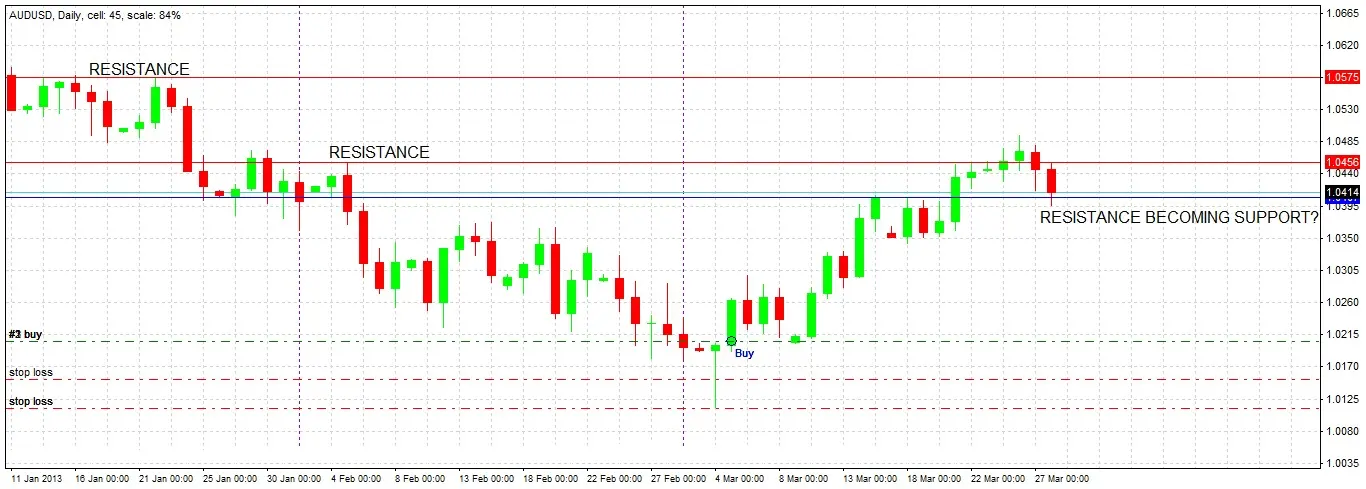
The daily chart prints a bearish reversal candle, and then another bearish candle the next day. This is concerning. We see that the price is currently sitting on a level at about 1.0407 that acted as resistance a few days ago. We need to see if this resistance will turn into support, or whether a daily candle will close below the zone.

Bullish Sign
The level did act as support and was not broken by a daily close, we can see a few days later that the daily candles have turned around and are now acting bullishly again. Now we need to wait and see how the price will act if it hits the resistance level at 1.0456.
Retest of Support
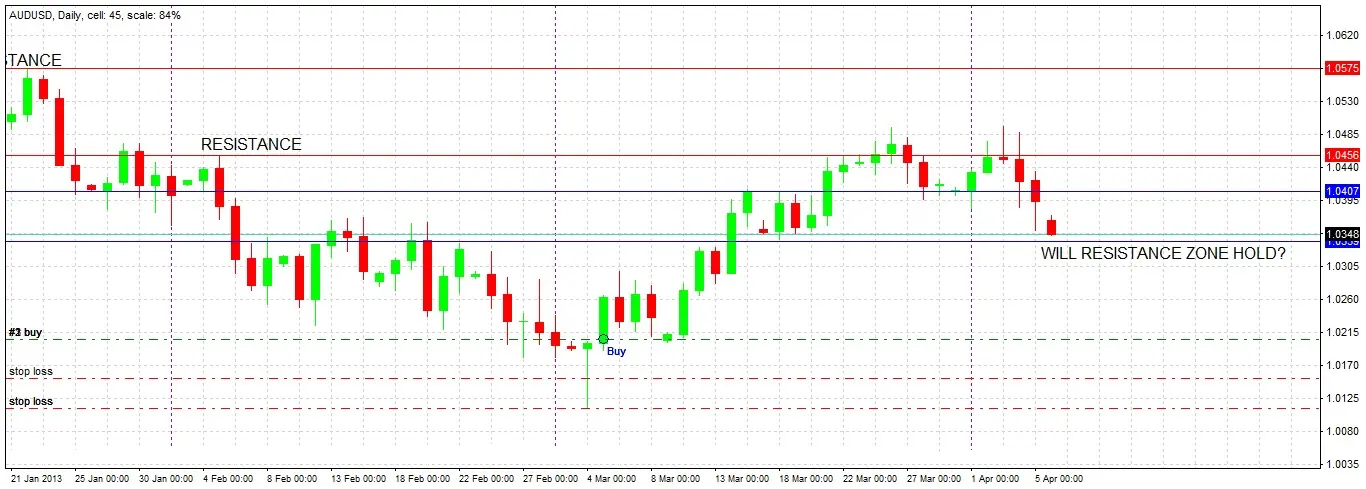
A few days later, the support level is retested when the price falls again after being unable to rise past the resistance zone where our first exit was. We are concerned, so we draw the lower boundary of the support zone that the price has penetrated. If a daily candle closes below that level, we will conclude the trade has turned bearish and exit the remainder of our position.
Exit 2
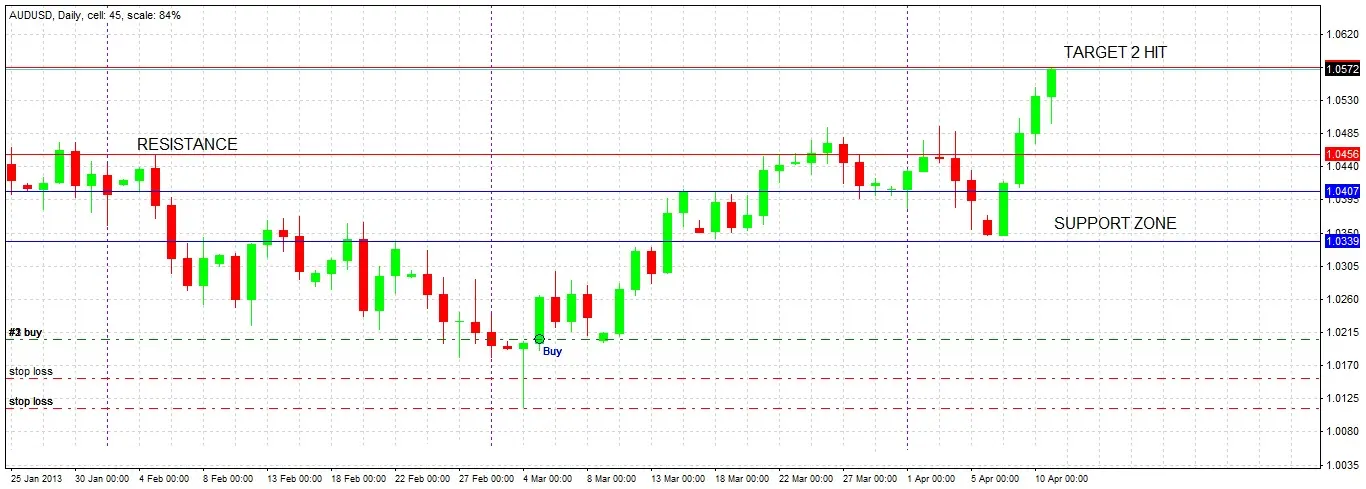
The support zone held, and the price broke back very bullishly to reach our second profit target of 1.0575 where we exit another quarter of the original position. We now have a realized profit of +2.99 units of risk with more unrealized profit on the table. As we are at a resistance zone, we will monitor the price action very carefully, as we still have a quarter of the original position open.
Chinese GDP: Below Expectations
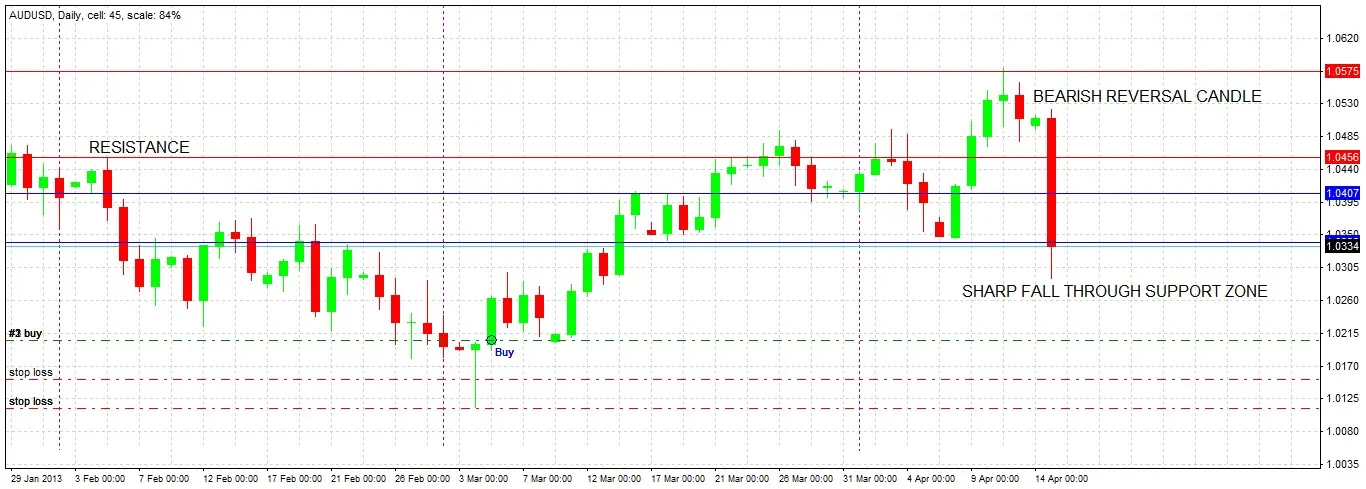
China announces that GDP grew at an annualized rate of only 7.7%, below market expectations. This produces a fall in global stock markets, and is particularly pronounced in Australia, which is closely linked to the Chinese economy. The Australian Dollar also suffers a sharp fall.
Boston Marathon Bombing
Initial reports of a bombing incident in the USA causes sudden sharp falls in global stock markets already spooked by the Chinese GDP numbers. In Forex, there is a flight to safety i.e. money flowing into USD, JPY and CHF, with sharp falls in “risk” currencies such as AUD. This is bad news for our position.
Final Exit
The daily chart prints a bearish reversal candle off the resistance zone where we made our second exit, reacting to the Chinese GDP figures, before falling dramatically the next day through the support zone in the wake of initial reports about the Boston Marathon Bombing. The range of this bearish day is enormous, it is the biggest daily price change during the last 10 months. This is a very bearish sign, so we decide to exit the remainder of our position. The trade is still in profit. We end with a total profit of +3.40 units of risk.
Conclusion
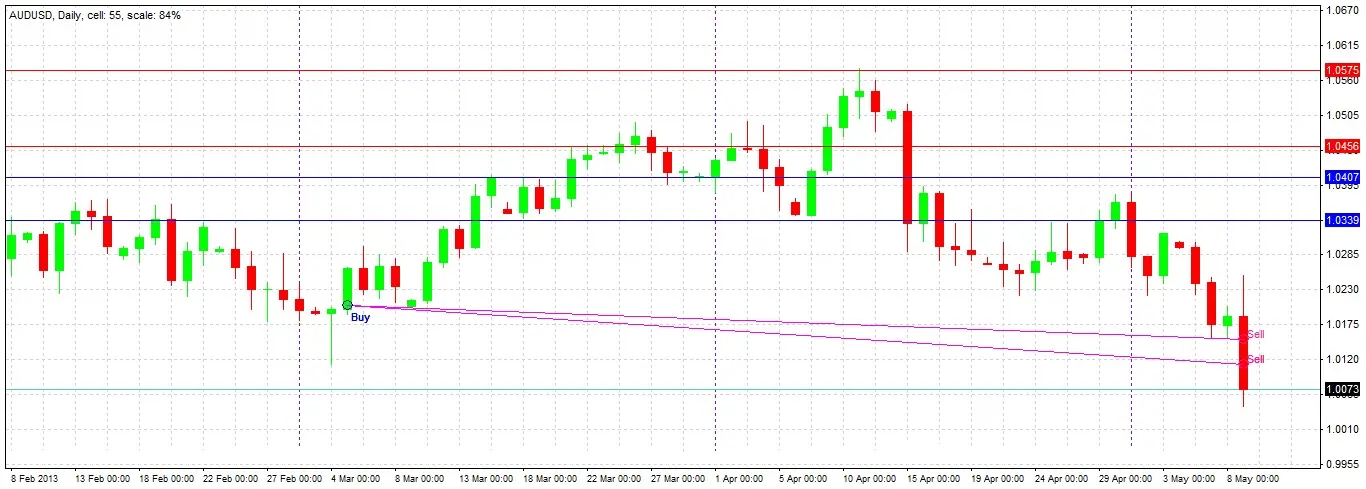
We made the correct decision in making our final exit, as if we had done nothing, we would have been stopped out on May 8. It is especially important in holding long-term positions that traders pay attention to the behavior of price at S/R zones. For example, we have seen that when resistance has become support, but is then broken to the downside, it is a bearish sign. Do not be too quick to exit, but be prepared to manage a trade when the balance of power between bulls and bears changes significantly. We increased the profitability of this trade by putting half of our position on a tight stop loss, we would have made 35% more profit if we had put all the trade on the tight stop loss. See the power of an appropriately tighter stop loss?
