AUD/JPY Trade
Demand Return Strategy Simulation: AUD/JPY Trade
Based on actual trading data from June 05, 2014. Using the Demand Return strategy on a major currency pair, we monitor multiple indicators to define an S/R zone, dropping down to a lower time frame to try to find a low-risk entry. The Demand Return signal, and position of support and resistance are considered before attempting to enter at a time of day that is appropriate to this pair. A successful trade is made over multiple exits.

AUD/JPY Trade
Subjects Covered:
- Demand Return
- Multiple Time Frame Coordination
- Signal Candles
- Time of Day
- Position of Support/Resistance
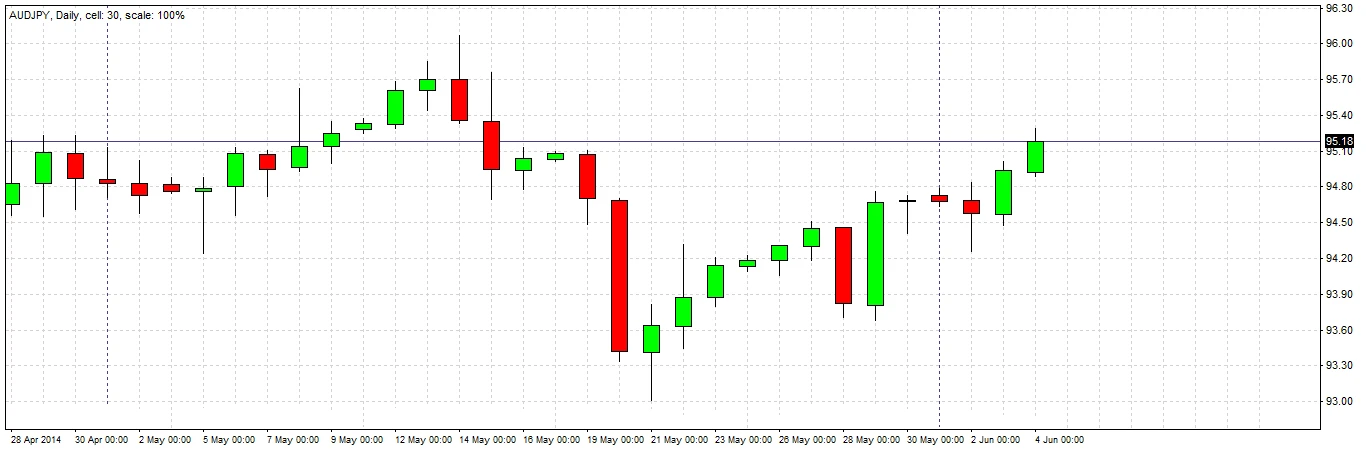
Signal 1
The price action of the daily candles shows two consecutive bullish candles. The closes of both candles are above the previous days’ highs and are each within the top halves of their own respective ranges. This is a bullish signal. We should continue analyzing the daily chart.
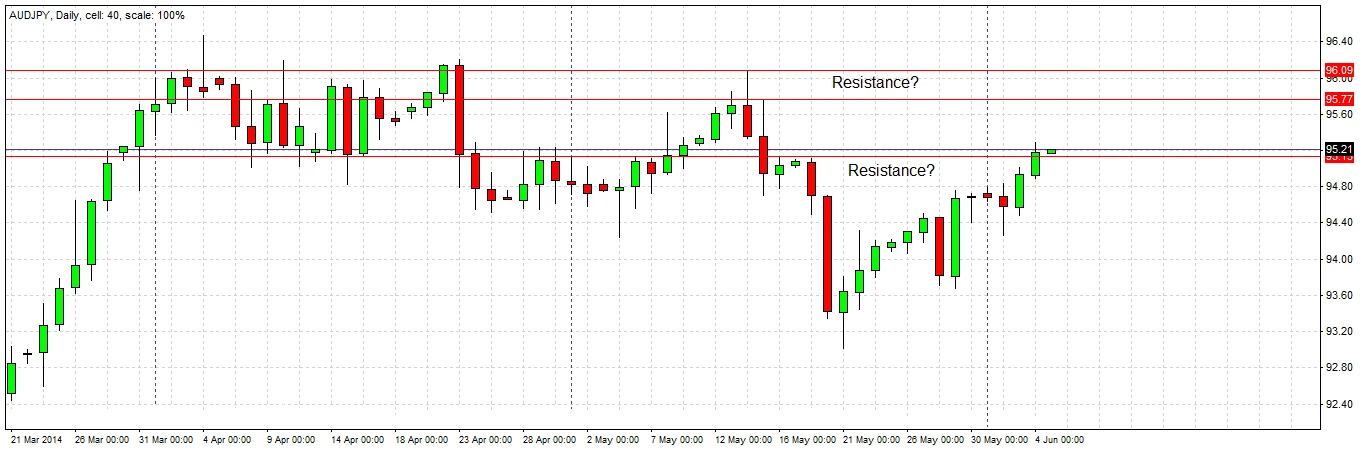
Caution?
We look to the left to see what was happening when the price was last in this area. There was some resistance, but we have closed above it already. There is no obvious resistance before 95.79, so we have some space for a trade. If we get a long trade, we should be careful of this resistance and look to exit in some profit close to this level.
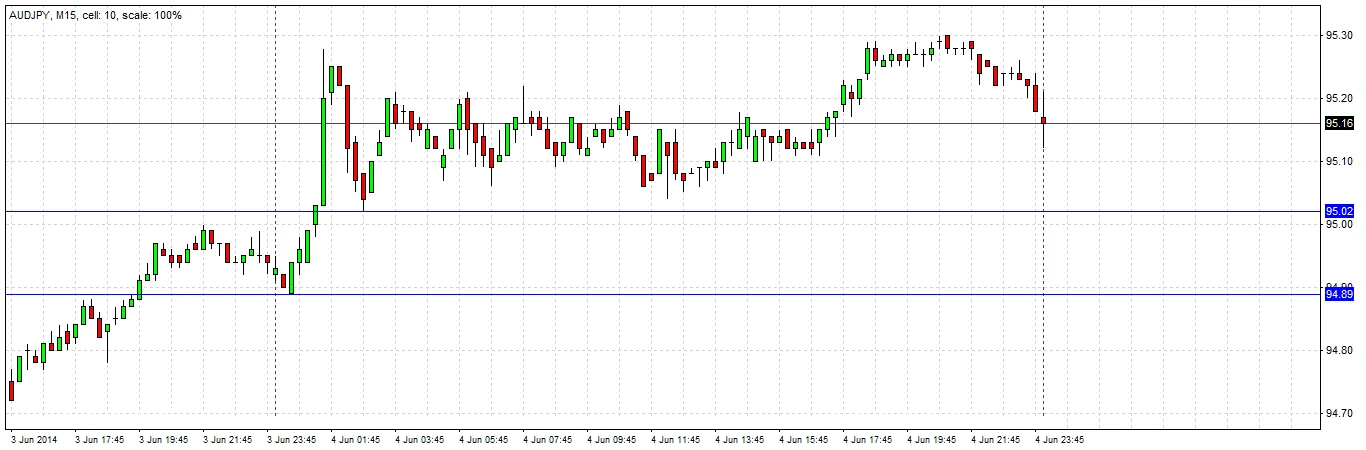
Begin Monitoring Lower Time Frame
We drop down to the 15 minute chart at the next Tokyo open to try to find a precise, low pips risk entry. We trade this strategy during the Tokyo session as it matches the market hours of the countries’ currencies within this pair. In this strategy, the supply zone is defined as the area between the first daily candle’s high and the low of the second daily candle.
In the Zone
During the first half of the Tokyo session, the price falls quite strongly well into the demand zone, marked with the blue lines. We are on the lookout now for a long trade once a good supportive candle forms on the M15 time frame.
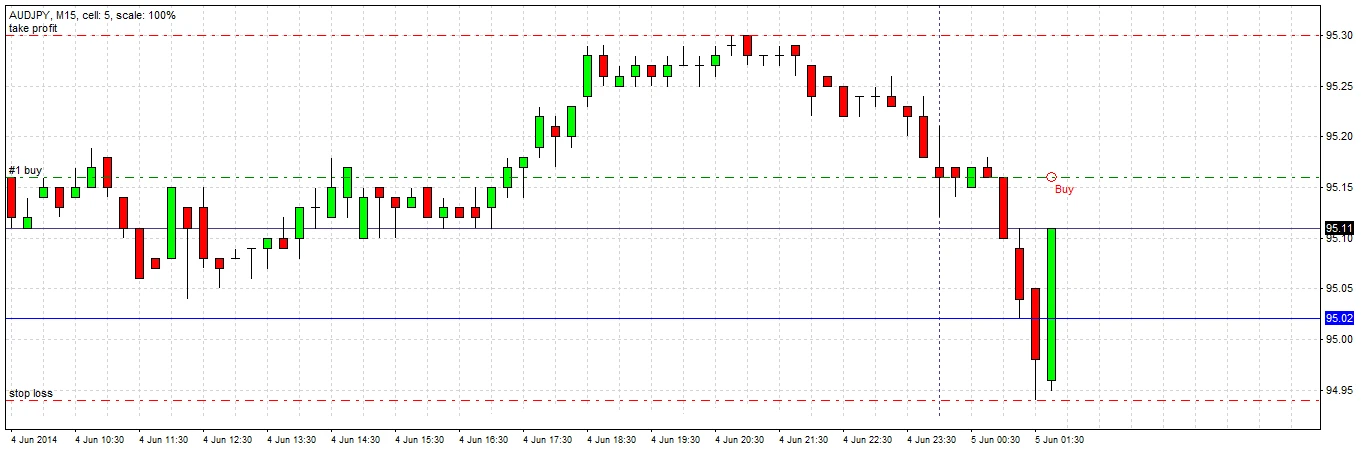
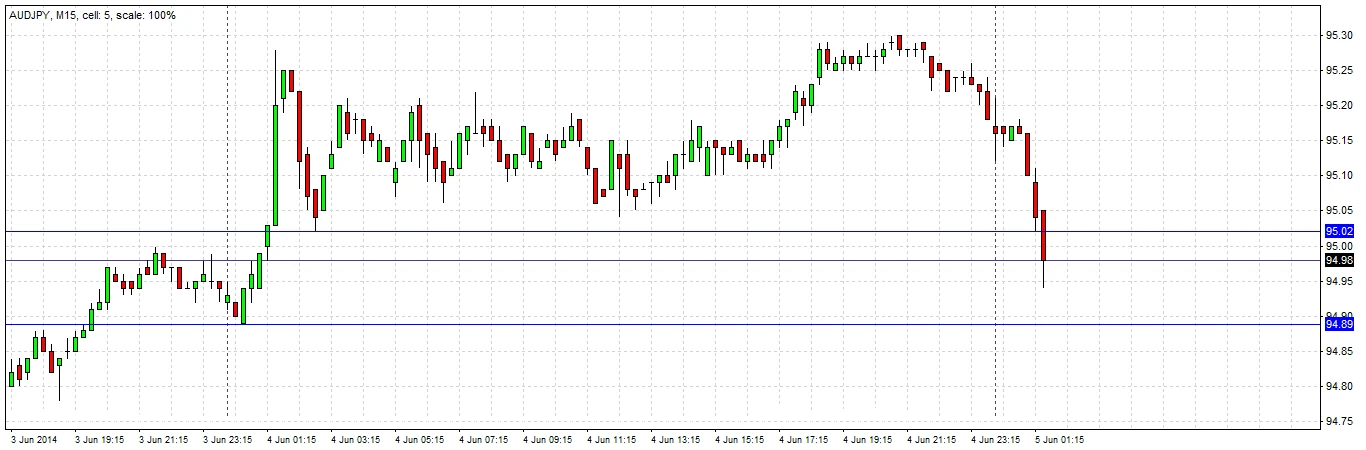
Entry
The very next candle is a strongly bullish engulfing candle, that closes right on its high, well outside the high of the demand zone. This is a very bullish sign in that it is a very strong candle and we have rejected the demand zone right away. We enter long, placing our stop loss just under the swing low.
A natural first profit target is yesterday’s high.
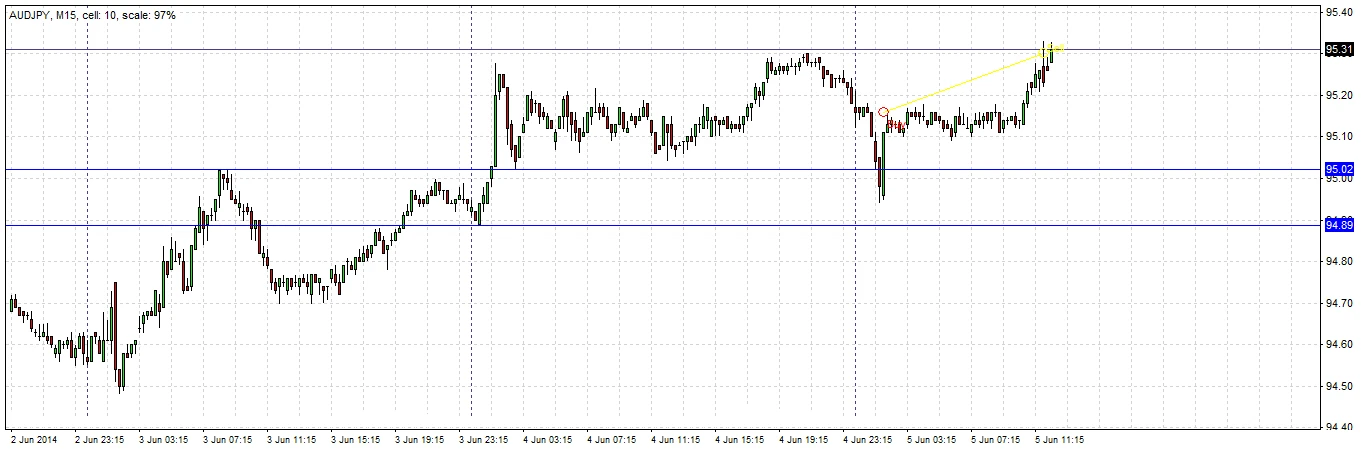
Exit 1
Shortly before the New York open, our first profit target at yesterday’s high price is hit. We decide to exit half of the position here, as we are concerned that it took so long for the price to rise. Unfortunately our profit here is small and not even enough to cover the rest of the trade, so we will move our stop loss on the remainder of the position to break even, and look to exit from more of the trade at the resistance we identified earlier at 95.79.
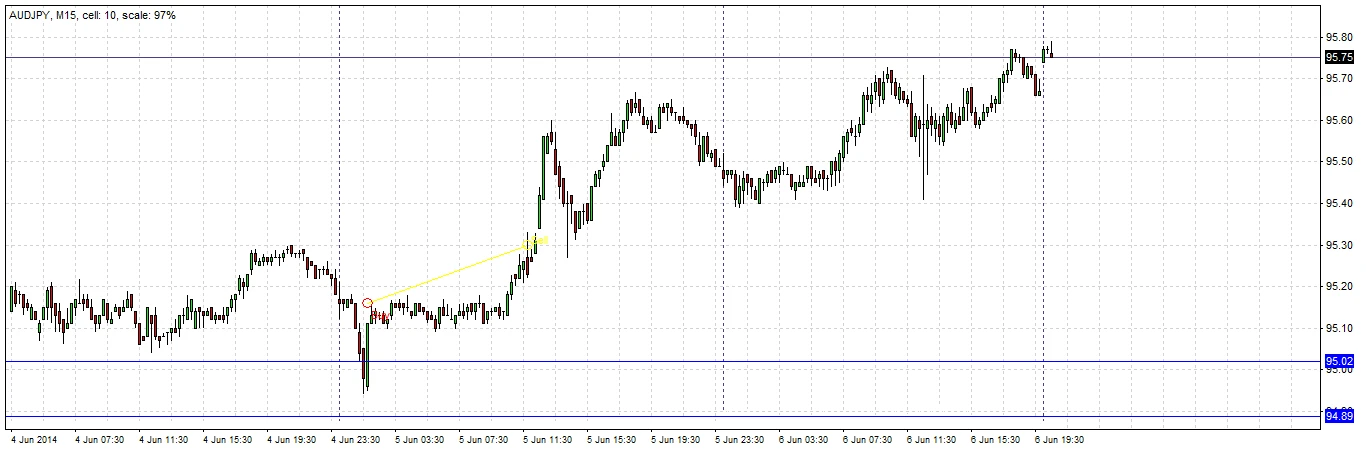
Exit 2
Right at the open of the next week, our gamble pays off, as we reach 95.79. We decided to take off half of the remainder at this level, and we will trail the rest of the position with a stop loss under each day’s low now. This means that our first trailing stop is at Friday’s low of 95.39.

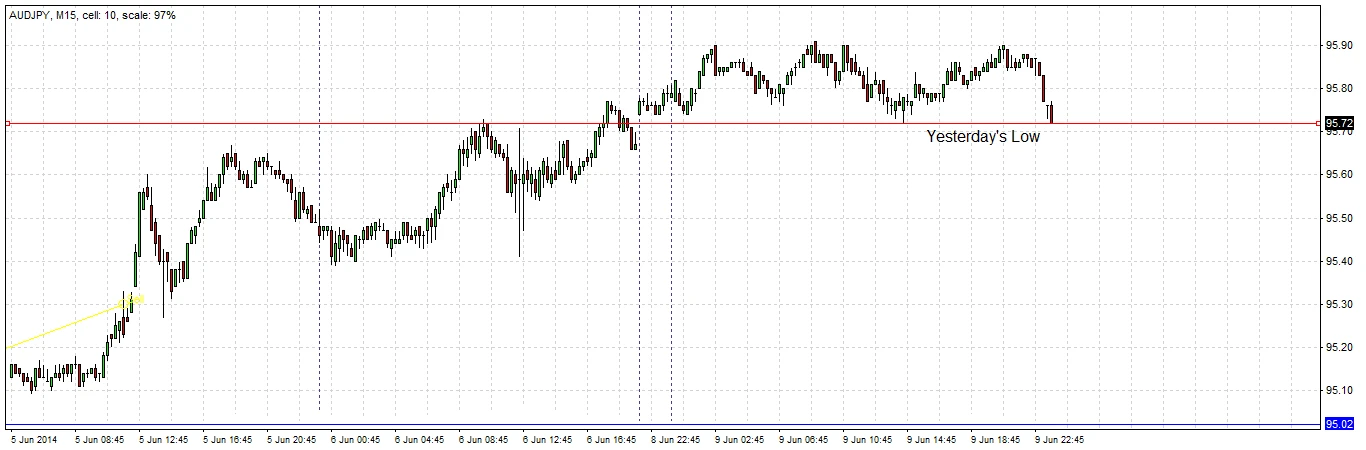
Final Exit
The very next day, we are stopped out at Monday’s low. We are now completely out of the trade, for a profit.
Conclusion
We could have made much more profit if we had been more courageous. However the trade did start slowly, and we protected ourselves from loss and locked in some profit as appropriate.
Our total risk was 20 pips.
Our total profits were:
50% of position at +15 pips = 0.5 X 15/20 = 0.38.
25% of position at +64 pips = 0.25 X 64/20 = 0.80.
25% of position at +57 pips = 0.25 X 57/20 = 0.71.
Total = +1.89 units of risk.
