EUR/USD Trade Example 2
Bollinger Bands Strategy Simulations: EUR/USD Trade Example 2
Based on actual trading data from Dec 18, 2014. We have selected patterns as perfect examples on specific historical dates. Using the DBBs strategy on a major currency pair, we monitor multiple time frames to select a pin point entry. The DBB signals, strength of the trend, and position of support and resistance are considered before entering at a time of day that is appropriate to this pair. The trade performs very well.

EUR/USD Trade Example 2
Subjects Covered:
- Bollinger Band Momentum
- Multiple Time Frame Coordination
- Signal Candles
- Time of Day
- Position of Support/Resistance

Signal 1
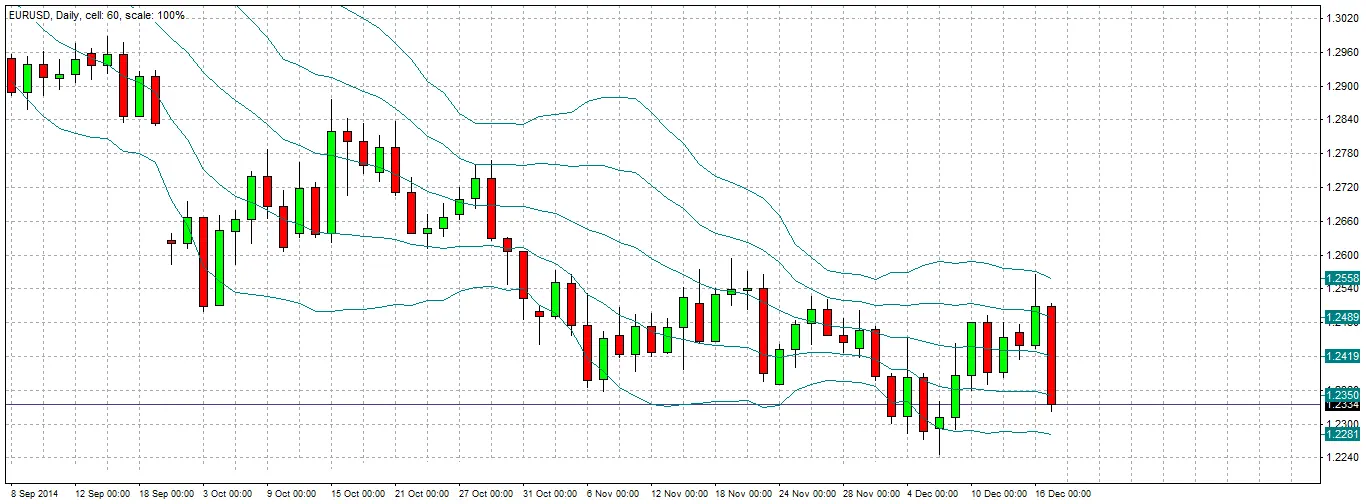
DBBs applied to the daily chart shows a change of status, with a first candle closing in the sell zone. The lines of the Bollinger Bands are also pointing down at least slightly. These are signals to look and see whether there are any other indications also supporting opening a short trade.
Signal 2
The daily candle is very strongly bearish, closing hard on its low and engulfing the real bodies of the previous 5 daily candles. Moreover, this pair has been in a long-term bearish trend for several months. These are good indications that it is a good time to go short. We should ask ourselves next, are there any reasons for caution?
Caution!
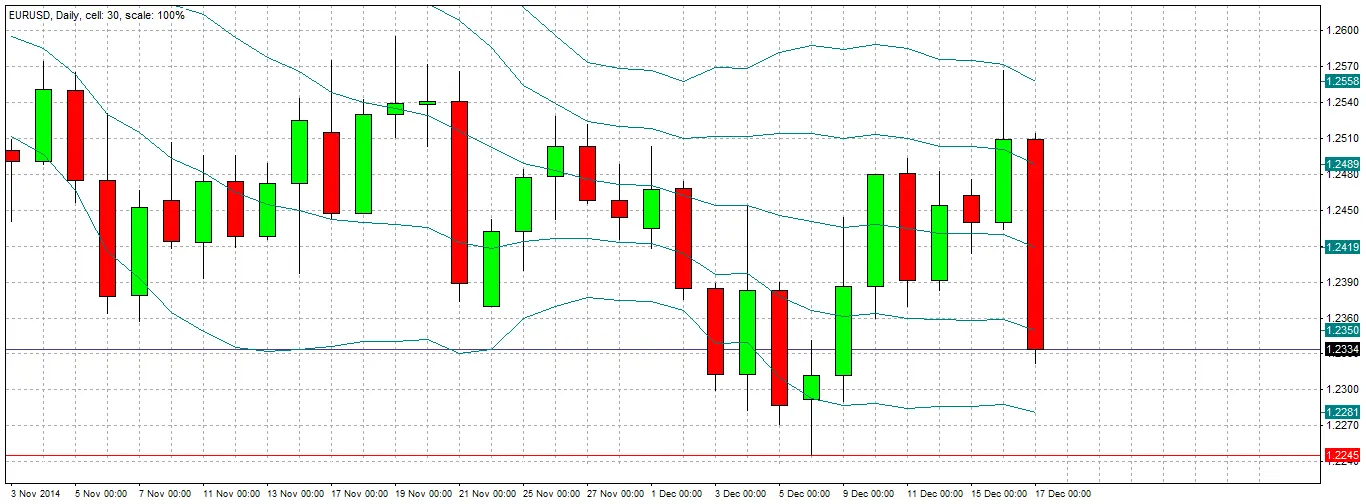
Looking at the daily chart, we can see that we are approaching a zone of potential support below. We can see this from the wick of the candle that rejected this price level when the price was last here, at 1.2245. So we need to be careful if/when we restest that price. To minimise risk, we can drop down to a lower time frame to look for a good entry. This is multiple time frame analysis.
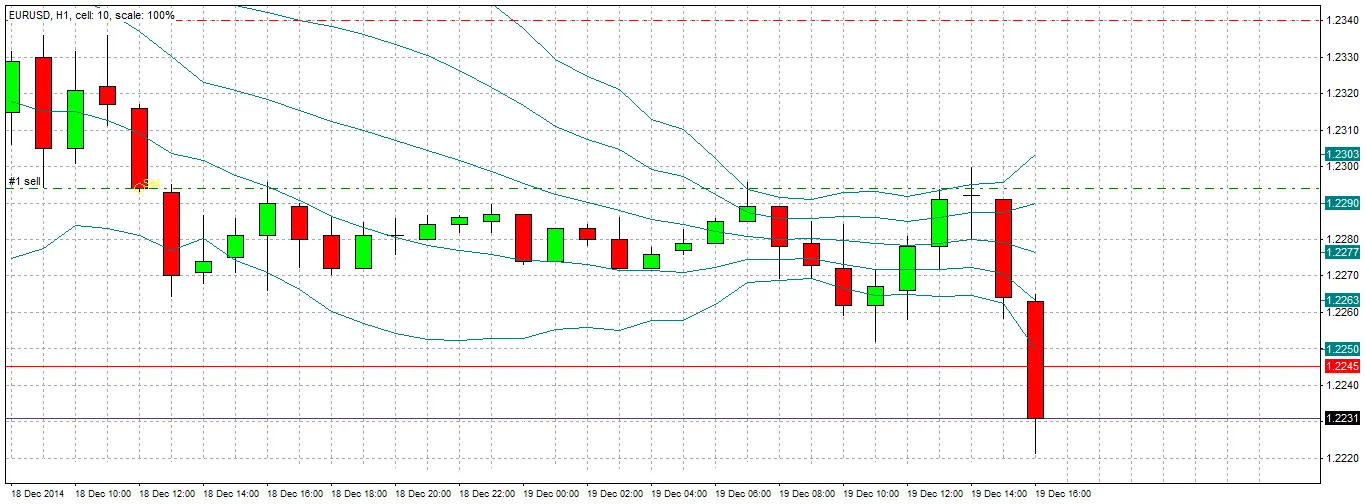
Begin Monitoring Lower Time Frame
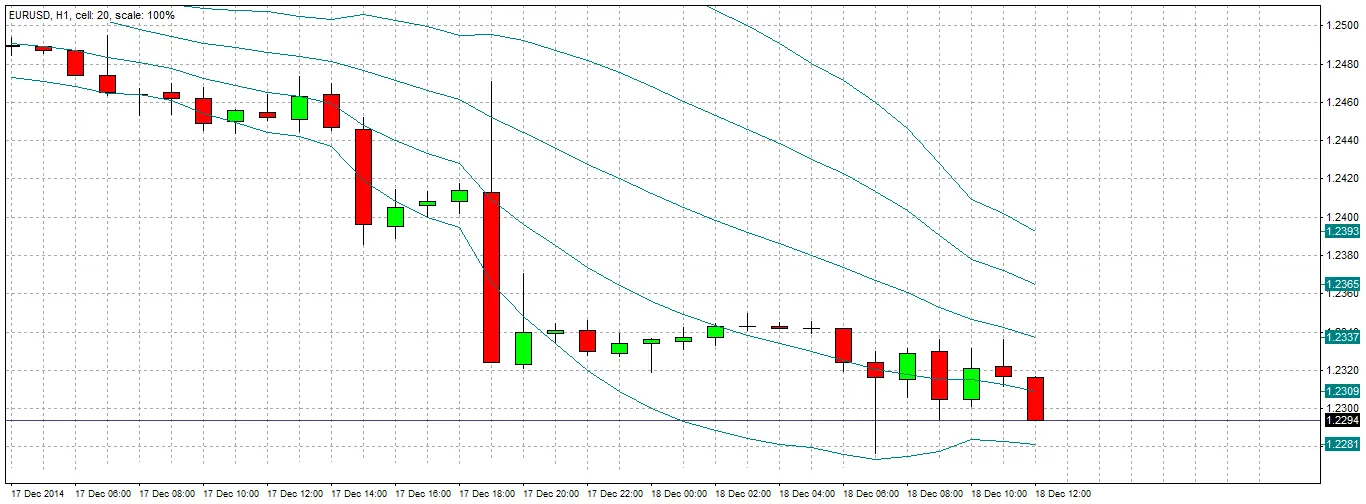
We wait for the London Open tomorrow morning at 08:00, because it is not usually a good idea to trade this pair between the New York Close and the London Open due to low liquidity. DBBs applied to the hourly chart at the London Open the following morning show the candles are not really closing firmly in the sell zone yet. We have to wait a few hours for that to happen, with a candle closing right on its low around the New York Open.
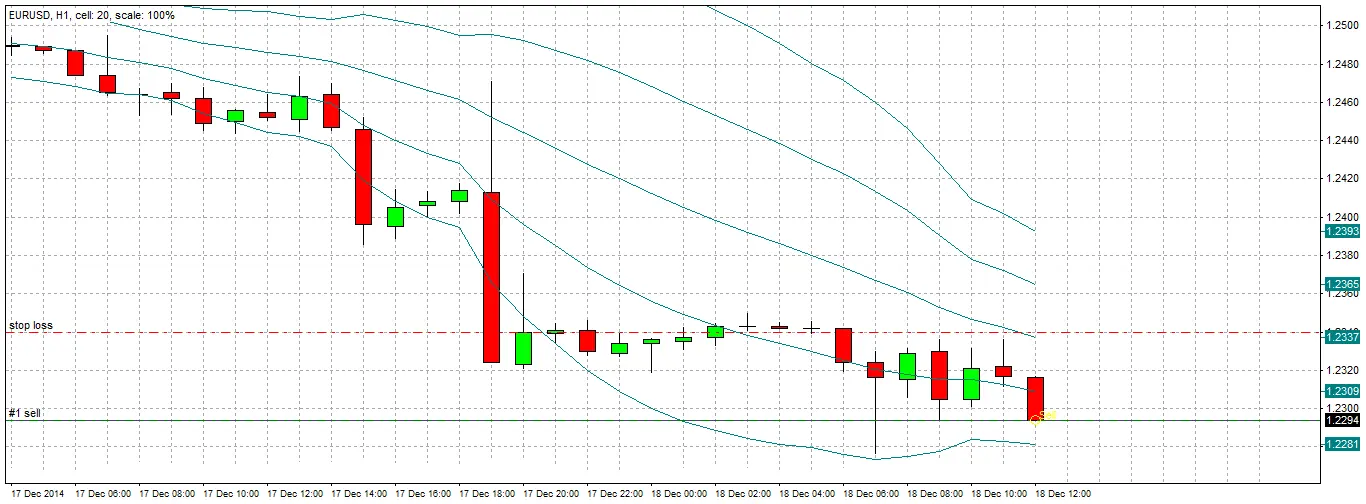
Trade Entry
We decide to enter the trade with a short at the market price. Our stop is quite tight, just above the local swing high, about 40 pips away.
Breaking Support
The chart shows that the trade initially moved into profit but took about a day to get going. Note that despite the delay, the trade never really moved into negative territory, which can be a reason to be patient with a trade. Significantly, the price has broken through the level we were cautious of with strong bearish candles. It makes sense to watch and wait now, and hope the trade continues to move further into profit.
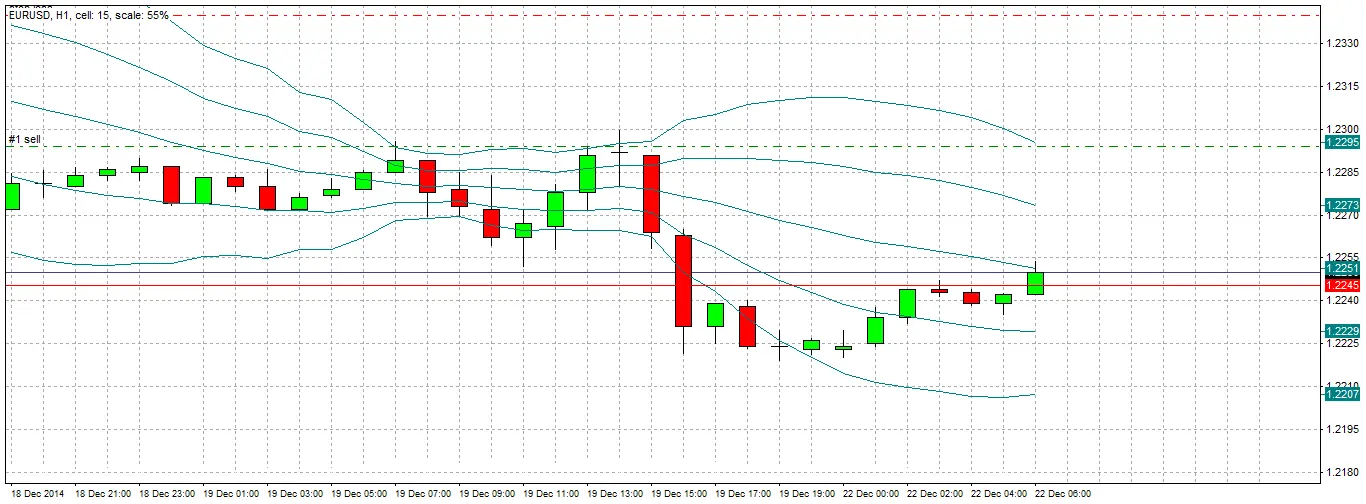
Trade Management
After the weekend, we arrive at the London Open on Monday morning. The hourly chart here shows that the price is closing up in the neutral zone. This is a signal to exit if we are only concerned with a short-term trade. However, as this pair is in a strong long-term downtrend, we decide to be more ambitious, and move the stop loss to break even. We will wait for a daily candle to close in the daily neutral zone before exiting. We could take a moderate profit now equal to about 1 unit of risk, but we decide to go for potentially much more.
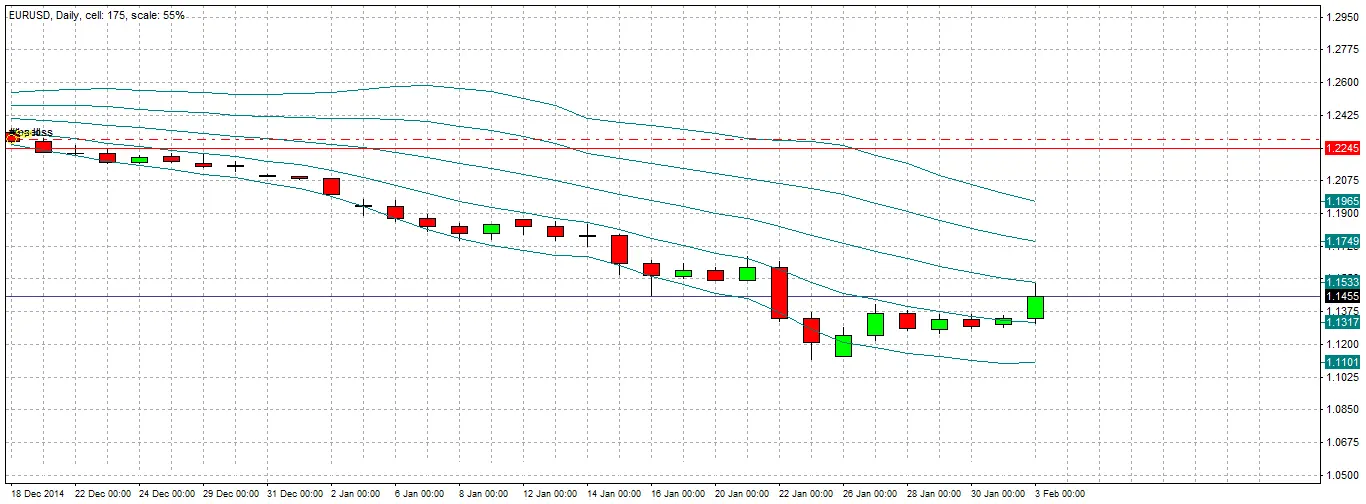
Exit
Waiting for a daily candle to close in the neutral zone was a great choice. By zooming out to a higher time frame, we rode the trend for a total profit of about 800 pips, a reward to risk ratio of about 20 units, compared to our 40 pip stop loss.
Note how the price fell steadily in the daily chart almost straight after entry, although it took a day or two to get going.
