Complete this quiz and
proceed to the next lesson
Start Quiz

In a previous lesson, we learned about Bollinger Bands as an indicator that can be useful in flat or gently trending markets, but not during strong trends. Now we will learn about Double Bollinger Bands (DBBs).
Double Bollinger Bands are a powerful variation on the standard single Bollinger Band, because they tell us much more about momentum and hence trend strength, both in flat and strongly trending markets.
This lesson will show that unlike standard Bollinger Bands, Double Bollinger Bands are exceptionally useful in strongly trending markets, because they help us to better determine the true momentum shown within the candlestick price action.
I've mastered this topic, take me to the next lesson
We strongly recommend you open a free trading account for practice purposes.
Bollinger Bands are used to measure a market's volatility. It is a technical analysis tool that is comprised of three data points that together create an upper and lower trading channel (band) that are two standard deviations from the middle line.
Bollinger Bands measure mid-term trend. price fluctuations between the upper and lower bands measure volatility and deviation from the 20-day simple moving average.
In addition to the standard Bollinger bands, whose settings are 20 periods and two standard deviations, Double Bollinger Bands add on the 20 period, one standard deviation, so it creates four bands, or zones. The two bands on the top are known as the uptrend zone; the two bands on the bottom are known as the downtrend zone. So if the currency pair has a very strong uptrend, usually it will remain in the one-two band on the upside. If it’s in a downtrend and the downtrend is strong, it will be in the one-two band on the downside.
Double Bollinger Bands inform the trader whether a currency pair is in a trend or range, the direction of the trend and when the trend has exhausted. Additionally, Double Bollinger Bands identify entry points and proper places to put a stop.
The Double Bollinger Band trading system is the only trading system that uses two Bollinger Band indicators with different historical periods.
Earlier we learned a bit about standard Bollinger Bands (hence BBs for short) as support/resistance indictors. The key point was that they are useful S/R indicators only in flat or gently trending markets, but not during strong trends.
The Double Bollinger Bands definition (or DBBs for short) is a powerful variation on the standard single version because they tell us much more about momentum and hence trend strength, both in flat and strongly trending markets. In fact, unlike standard Bollinger Bands, they are exceptionally useful in strongly trending markets because they help us to better understand:
As the name suggests, Double Bollinger Bands consist of 2 sets of BBs:
A set of BBs at the usual 2 standard deviation distance above and below the 20 period simple moving average line in the middle
and
A second set of BBs plotted just 1 standard deviation above and below that central moving average
These are just the usual default settings. Traders can, and do, tinker with the type and duration of the moving average, and the number of standard deviations.
Here is how to plot Double Bollinger Bands:
First, plot a standard set of BBs. Using a typical charting package that means going to your menu of technical indicators and just selecting Bollinger bands, along with the standard (2, 20) settings (which stand for 2 standard deviations and a 20 period simple moving average.
Then repeat the process by again selecting Bollinger bands from you list of available indicators, but this time change the settings from 2 standard deviations to 1 standard deviation.
That’s it. You may want to change the color of one of these sets of BBs, as well as the color of your central 20 period moving average, so that they’re easier to see among the other indicators that you may have on your chart.
Here is an illustration:
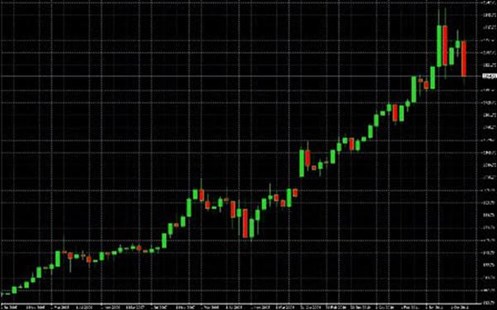
Here’s the same gold chart we saw in the last lesson:
Here’s that same chart with DBBs plotted on it:
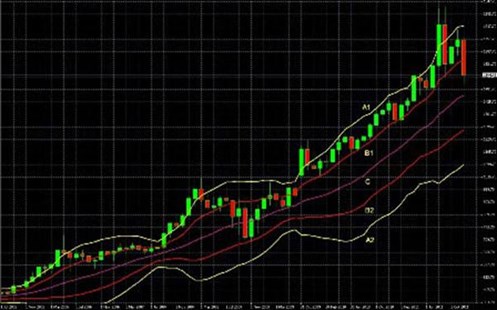
Here’s a brief explanation of each line.
SMA. Again, this is both the center of the Double Bollinger Bands and baseline for determining the location of the other bands.
These bands mark three separate zones. These zones provide the added information about the strength of a trend.
In other words, even if there is no other S/R to serve as a reference point (as was the case with gold until late 2011), when price enters one of these zones, we have a better idea of whether price is likely to
We’ll look more closely at these 3 zones and their meaning in the next article.
Follow us on:
![]()
![]()
![]()

We hope you found our site useful and we look forward to helping you again soon!
