Complete this quiz and
proceed to the next lesson
Start Quiz

I've mastered this topic, take me to the next lesson
We strongly recommend you open a free trading account for practice purposes.
When viewing candlestick patterns in terms of trading, it is important to keep in mind where the current price pattern appears with respect to the background market environment.
The same candlestick pattern can have numerous meanings, depending on where it occurs in the market. A trader must consider where the pattern is occurring on the chart when determining the impact of a candle pattern. It is important to pay close attention to the key locations of the patterns because changes of sentiment at these locations can have very significant meaning for future market bias.
These 'important locations' will typically be any location which plays a part in defining your market structure or your trend. When placing a trade, the key areas to consider are: support/resistance level, trends and any high and low swings.
Candlesticks provide an excellent means to identify short-term reversals, but should not be used alone. A candlestick reversal pattern indicates that buyers overcame prior selling pressure, but it remains unclear whether new buyers will bid prices higher. To be considered a bullish reversal, there should be an existing downtrend to reverse.
Hammer candlestick patterns form when a security moves significantly lower after the open, but rallies to close well above the intraday low. The resulting candlestick looks like a square lollipop with a long stick. If this candlestick forms during a decline, then it is called a Hammer. A Doji candlestick pattern will form when a security's open and close are virtually equal. The length of the upper and lower shadows can vary, and the resulting candlestick looks like, either, a cross, inverted cross, or plus sign. Dojis convey a sense of indecision or tug-of-war between buyers and sellers. Prices move above and below the opening level during the session, but close at or near the opening level.
This lesson introduces a new key concept: S/R.
“S/R” is a convenient, abbreviated term for “support/resistance”.
Support/resistance may sound confusing but it is very simple. It is simply a term for a price level that is believed to be difficult for the price to pass through at a given time.
For example, if the price is at 1.2990, and 1.3000 is referred to as resistance, this simply means that it is believed to be likely that the price will not be able to rise much above 1.3000 before falling back below it.
If the price is at 1.3010, and 1.3000 is referred to as support, this simply means that it is believed to be likely that the price will not be able to fall much below 1.3000 before rising back above it.
Support and resistance are essentially the same thing, it is just that we tend to refer to levels lower than the current price as support, and levels higher than the current price as resistance.
The lesson’s video outlines some key points about S/R:
Being able to gauge the strength of an S/R level is basic for predicting price movements.
To gauge the strength of a given S/R level, and thus predict whether or not the price is likely to break through, it is important to look at how well the S/R level fulfills the IRATE criteria:
Indicators: The number and quality of S/R technical indicators that converge on a given price level. The more indicators at one price level at the same time, the stronger the S/R level. We’ll learn about these indicators in coming lessons. For now, just know that these labeled lines in the chart below are s/r indicators. Each alone can provide a degree of S/R. The more that meet at a given price area on the chart, the stronger the S/R.
Round Number in Forex: Our brains remember round numbers more easily, and assign more importance to them. That’s why the EURUSD has stronger S/R at 1.3000 than at 1.2982. That is also why a retailer will price an item at 2.99 which he knows feels cheaper than 3.00. When analysts refer to given stock index level as “psychologically important,” they often mean it’s a big round number. For example, it’s a big deal when the S&P 500 breaks past 1300, 1400, 1500, etc.
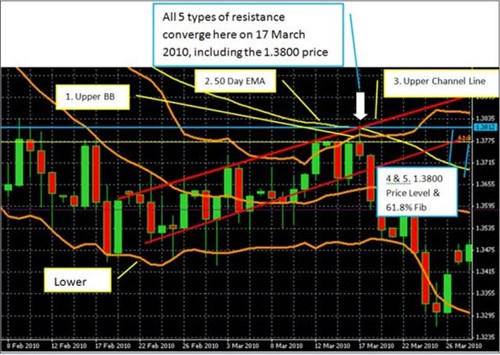
EURUSD DAILY CHART , FEBRUARY 8 TO MARCH 26, 2010
Source: The Sensible Guide To Forex: Safer, Smarter Ways To Survive And Prosper From The Start (Wiley & Sons 2012) and Metaquotes Software Corp.01 NOV 06 1718
Age: The older a zone is, the more likely it is to hold as S/R. For example, an S/R level is much more significant if it hasn’t been hit in many years or months than one that hasn’t been reached in days or weeks.
Tested: The more times an S/R level has been tested but not decisively broken (that is not breached for more than a few occasional candles), the stronger it is because it’s proven its strength.
For example, note below how often the 1.3775 area is tested as resistance and holds firm. There is no doubt that part of the reason is not only it’s a round number; it’s also supported by the presence of another important S/R indicator in the same level, the 61.8 % Fibonacci retracement line in yellow. Here’s another example of how the presence of multiple S/R criteria and technical S/R indicators reinforces a given S/R level.

EURUSD DAILY CHART, FEBRUARY 8 TO MARCH 26, 2010
Follow us on:
![]()
![]()
![]()

We hope you found our site useful and we look forward to helping you again soon!
