This lesson reviews Rule 4 of the DBB trading strategy rules. Rule 4 attempts to cut the risk of buying at the top or selling at the bottom that comes with chasing a strong trend that has already made significant progress and may be approaching major resistance or (if it has broken past historic highs or lows) exhaustion.
This rule is not easy to implement. Your success depends on how well you read and interpret the other technical and fundamental evidence, therefore we will talk about how to distinguish a bargain from a “falling knife” (i.e. an apparent bargain that continues moving against you after your trade entry, resulting in a loss).
I've completed all lessons on this course, take me to the course syllabus page
We strongly recommend you open a free trading account for practice purposes.
Rule 4 of the Double Bollinger Band Trading System states that a trader should minimize risk by either waiting until price retraces to the cheaper end of the buy or sell zone, or by entering positions in stages. This rule attempts to cut the risk of buying at the top or selling at the bottom that comes with chasing a strong trend that has already made significant progress and may be approaching major resistance or (if it has broken past historic highs or lows) exhaustion.
Double Bollinger Bands is only one type of indicator used by advanced Forex traders. Experienced traders and investors use a combination of both fundamental and technical analysis before placing their trades. The mix depends greatly on the both personal preferences, and especially on their preferred time frames. Long term traders lean more towards the fundamentals because most fundamental factors take time, sometimes months or many years, to fully exert their influence following rules for using them. Short term traders who enter and exit the market within less than one day or just a few days need to be much more focused on technical indicators shown on charts.
Using Double Bollinger Bands is one way for short term traders to gauge how these forces are likely to influence short term price movements over the coming minutes, hours, or days via technical indicators. By following the rules on how to properly view them, Double Bollinger Bands can be very useful for short term traders.
The lesson's video ends with a recommendation to ensure a more effective use of DBBs by combining them with leading indicators such as moving average crossovers and/or MACD or other oscillators.
The classification of particular indicators as leading or lagging can be controversial. For our purposes, MA crossovers and MACD can be deemed to be leading indicators, but they are classically seen as lagging indicators. Stochastics is an oscillator and an undisputed leading indicator. The most leading indicator of all is candlestick analysis. The important thing is that some other form(s) of analysis is combined with DBBs.
The lesson's video summarizes Rule 4 of trading DBBs:
Minimize Risk By Either Waiting Until Price Retraces to the Cheaper End of the Buy or Sell Zone, Or Enter Positions In Stages
In other words:
Again, your final decision would be based on your reading of both other technical and fundamental signals.
This rule attempts to cut the risk of buying at the top or selling at the bottom that comes with chasing a strong trend that has already made significant progress and may be approaching major resistance or (if it has broken past historic highs or lows) exhaustion.
This rule is not easy to implement. Your success depends on how well you read and interpret the other technical and fundamental evidence, so that you better understand the odds of catching a bargain rather than the dreaded “falling knife” (i.e. an apparent bargain that continues moving against you and results in a loss).
Thus the key qualification to Rule 4: Consider the full range of evidence available, both technical and fundamental. There should be no major contradictions from other technical indicators or fundamental data that suggest the trend is in fact exhausted. If there are, stand aside, and don’t trade until the situation clarifies. As always, to protect yourself against that “falling knife,” have a stop loss order in place to prevent an unacceptable loss.
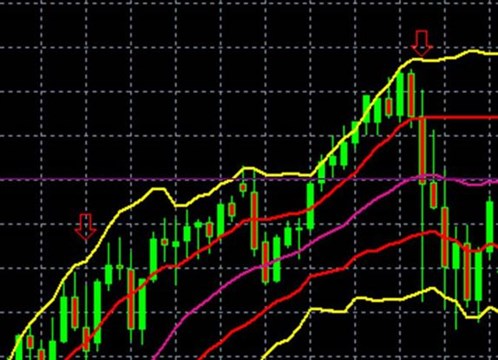
For example, look at Figure 8.7.

FIGURE 8.7 S&P 500 Weekly Chart, Week of September 27, 2009, to April
25, 2010
Using the rule got you a bargain price if you bought at the lower end of the buy zone during the week of September 27, 2009 (first down arrow
However, if you bought at the close of the week of April 25, 2010 (the topmost red candle, the eighth from the right), you caught a falling knife, as a threatened Greek default set off a sharp four week sell off.
The key to avoiding that loss was to recognize that the fundamentals were so bad at that point that they outweighed the suggested bargain of Rule 4.
What would have kept that loss affordable? In addition to reasonable stop losses
(which we always use, right?), Rule 4 also suggests entering positions in stages (rather than all at once) when chasing a strong trend that looks like it still has the momentum to run higher.
For example, during a strong uptrend, if you’re afraid of missing any further moves higher, buy a third of your total planned position even if near the top of the buy zone, another third when price retraces to the lower end of the buy zone, and another third when or if price bounces back into the middle of the zone.
Combine DBBs with a Leading Indicator
Because trends need time to build up enough momentum to enter the buy or sell zones, Double Bollinger Bands are distinctly lagging indicators and thus not good at catching briefer though perfectly tradable trends.

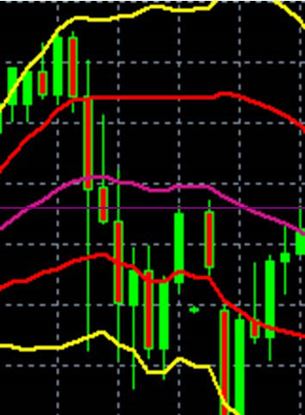
FIGURE 8.8 S&P 500 Weekly Chart, Week of April 25, 2010, to August 1, 2010
For example, as we see in Figure 8.8 above, if you had used only DBBs to time your entries and exits during the Greek stage of the EU debt crisis that occurred in the spring of 2010, you would not have shorted the downtrend until it was mostly exhausted.
Thus DBBs are much more effective when used with some kind of leading indicator that gives hints of moves before they happen, or at least far earlier than DBBs. There are many of these among the family of momentum and timing indicators, like moving average crossovers, or one of the oscillator type indicators like MACD. We’ll take a brief look at these in the following lessons

We hope you found our site useful and we look forward to helping you again soon!


