In this lesson we give a detailed explanation on the rules required as a basis for utilizing the Double Bollinger Bands trading with Bollinger Bands and candlesticks strategy successfully. We will show how to apply rules #1 & #2 to the 3 zone concept we learned previously.
I've mastered this topic, take me to the next lesson
We strongly recommend you open a free trading account for practice purposes.
Forex traders typically watch at least one major stock index that’s open during the times they trade, because it will tell them a lot about how a given pair is moving. When stock indexes are rising, so should risk pairs, while safe haven pairs should be falling. There are other useful barometers of overall market risk sentiment too, but we’ll cover those another time.
Rule 1: When candles continue to close in the DBB sell zone, that’s a signal to enter or maintain short positions, as well as to avoid long positions and to close any remaining open long positions. When price moves above this zone, it’s time to consider exiting short positions.
Rule 2: When candles continue to close in the uppermost zone, the DBB buy zone, that’s a signal to enter or maintain long positions, as well as to avoid short positions and to close any remaining shorts still open. When price moves below this area, it’s time to consider exiting long positions.
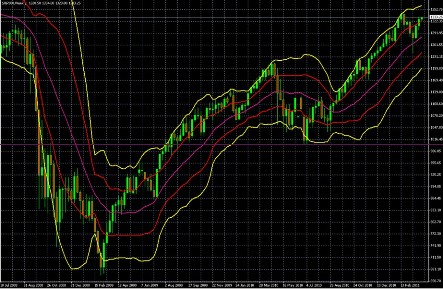
Throughout this text, we’ll be referring to various parts of this chart:

FIGURE 8.3 S&P 500 Weekly Chart, July 18, 2008, to April 3, 2011
Many of you may be wondering why we’re using a chart of a stock index and not using a chart of a currency pair. There are a few reasons.
First, the following rules apply to charts of any financial asset traded in a highly liquid market. Therefore a chart of the S&P 500 index illustrates the following rules as well as any currency pair chart.
Secondly, using the chart of the S&P 500, the #1 stock index (by market capitalization) in the world, allows me to introduce an important point.
Major global stock indexes are excellent barometers of risk appetite (optimism, or greed) or risk aversion (pessimism, or fear). Therefore they provide an excellent, quick summary of how most currency pairs should be moving.
Remember what we said earlier in the introductory part of this course about risk and safety currencies, and currency pairs.
So Forex traders typically watch at least one major stock index that’s open during the times they trade, because it will tell them a lot about how a given pair is moving. When stock indexes are rising, so should risk pairs, while safe haven pairs should be falling. There are other useful barometers of overall market risk sentiment too, but we’ll cover those another time.
It is important to remember: You can always ride downtrends using currency pairs.
As we said earlier in the introduction to the course, when stock markets are plunging hard during a crisis, stock exchanges often ban short selling. It’s impossible to ban the shorting of risk currency pairs because:
Therefore, you can always sell risk currency pairs during strong bear markets as a way to profit from general risk asset market downturns, or to hedge long positions in risk assets such as stocks, commodities, stock indexes, etc.
There are four rules of double Bollinger bands:
Rule 1
When candles continue to close in the DBB sell zone, that’s a signal to enter or maintain short positions, as well as to avoid long positions and to close any remaining open long positions.
When price moves above this zone, it’s time to consider exiting short positions.
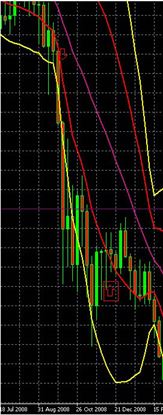
Here’s an example of that situation:

It’s just a zoomed-in look at the far-left part of the chart that we saw at the beginning of this lesson. Study the period of September 7 to December 14th. It’s bounded by the downward pointing arrow in the upper left part of the chart, and by the upward pointing arrow which is on the lower right.
Per rule 1, the odds favored shorting the index.
Rule 2
When candles continue to close in the uppermost zone, the DBB buy zone, that’s a signal to enter or maintain long positions, as well as to avoid short positions and to close any remaining shorts still open.
When price moves below this area, it’s time to consider exiting long positions.

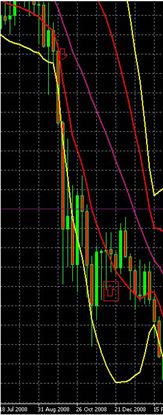
For example, look at this S&P 500 index weekly chart which just zooms in on another part of that same chart that we saw at the beginning of the video.
During the period of July 27 to September 27 (bounded by the arrows) the index was in the DBB buy zone, so the odds favored holding long positions, and opening new ones.
If you look back at the first chart of this video, you’ll see that just by using this rule, you would have caught most of the uptrend during the period covered, while avoiding the down periods.

We hope you found our site useful and we look forward to helping you again soon!


