Complete this quiz and
proceed to the next lesson
Start Quiz

In this lesson we will learn about the use of Forex Channels as a support/resistance indicator. Forex price channels are parallel or semi-parallel trend lines that surround a rising or falling trend at an angle and width that captures the overall slope of the trend, like a single trend line. However, price channels over certain advantages over single trend lines. Trading channels in Forex can yield better results than trading single trend lines, especially when the channel trend lines are symmetrical.
I've mastered this topic, take me to the next lesson
We strongly recommend you open a free trading account for practice purposes.
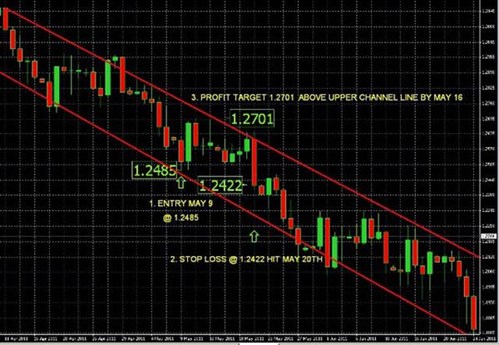
Using Price Channels, we can show a step by step breakdown of a trade illustrateting the dangers of trading against a trend that’s in a steep, narrow channel.
You enter near support.
You correctly identify a good entry point for a long EUR/CHF position near the bottom of the down trending EUR/CHF.
You enter near the low of the day around 1.2485 (1), with a planned sell limit to take profits entered in advance on your trading platform around 1.2701 (3), a realistic target which the price had hit two out of the prior three days.
The trade looked like a reasonable calculated risk with the odds in its favor. The entry was far enough below your entry point so that it would not be hit by just random price movements.
What Went Wrong: Down Trend Too Steep
However, even though the channel was wide enough to trade profitably (over 300 pips) and you had entered near the bottom of it, the trend was falling too fast for a channel of that width. By May 16, the upper trend line (resistance) was below what had been an otherwise realistic profit-taking point only five days earlier. Now that profit target was right at resistance and no longer a good bet.
If you were alert and lucky, you might have decided to alter your plan and exit that day. Your worst case exit at the low for the day at 1.2565 still gave a profit of 82 pips.
If you weren’t monitoring the trade, your stop loss was hit May 20 as the falling upper trend line held as resistance and price kept falling.
The big lesson to learn from all this is not to trade against a channel’s trend unless the slope is gentle and the channel is wide. When in doubt, don’t. Use the resistance line only as an area for taking profits. It is important to understand Price Channels as a support / resistance indicator before deciding to use them for placing a trade.
We already saw one example of Forex channels in the previous article when we described how to plot a flat trend.
As the name suggests, price channels (aka tunnels or sleeves) are parallel trend lines that surround a rising or falling trend at an angle and width that not only captures the overall slope of the trend like a single trend line, but also encompasses most or all of the price range, that is, most of the:
Again, the goal is to best describe the overall slope and price range, so don’t worry if your parallel lines marking the price channel don’t touch all of the highs and lows, or don’t encompass the entire trading range.
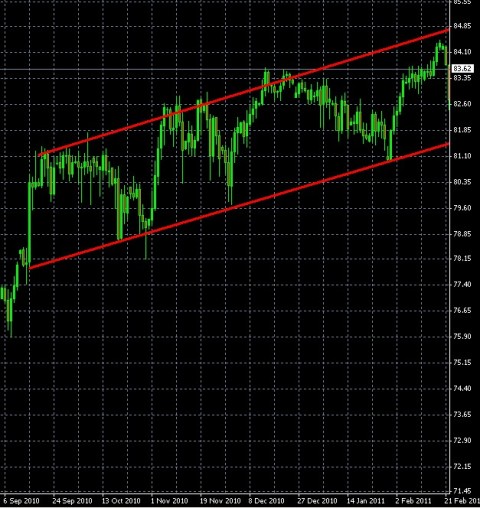
This is an example of a rising price channel:
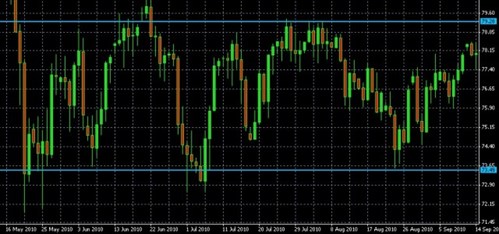
The graph above is an example of a flat price channel or trading range.
The graph above is an example of a flat price channel or trading range.
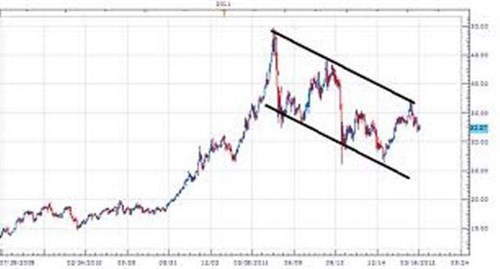
This is an example of a descending channel.
We prefer trading price channels in Forex over simple trend lines whenever the price range of a rising or falling trend can be captured by two parallel lines, because channels provide more useful information.
While single trend lines only tell us about the slope of the trend, the upper and lower trend lines of channels also tell us about the present and possible future trading range. In other words, those upper and lower lines may help us find the best entry and exit points.
For taking new long positions, we might try to buy near the lower price channel line, which is a kind of support, and sell near the upper price channel line, which serves as a kind of resistance. Whether or not we enter at the lower line and exit at the upper line would of course depend on the quantity and quality of the other IRATE criteria we find near these lines.
For short positions, we do the opposite, and consider entries near the upper line and exits near the lower line. Again, the final decision would depend on the quality and quantity of the other IRATE criteria we see near these lines.
There is a lot more to know about entering and exiting positions than that, and we’ll cover many of them later.
Here’s one detail that’s worth covering right now:
Be careful of using price channel lines to trade against the trend.
When you use the upper and lower price channel lines as entry and exit points, it’s tempting to try to play both sides of the trading range by going long near the lower line, then exiting near the upper line and opening a new short position there, with the goal of closing that position when price returns to the lower line.
However, trading both the up and down moves can be much harder if you’re trading against the trend, that is, trying to short in rising price channels or go long in descending price channels. As a general rule, don’t do it unless you have both of the following conditions:
If the slope is steep or the channel is narrow, you risk hitting resistance (and the need to exit) too quickly to give price enough time to move in your favor.
Figure 4.9 below shows an example of how a seemingly well planned trade closes with a loss because when you trade against the trend of a steep and narrow price channel, resistance moves closer with each candle and the trade doesn’t have enough time to move in your favor.
The other big advantage of channels over single trend lines is that price channels offer stronger trend reversal signals when price breaks out of the channel in the opposite direction.
In other words, when price breaks out above the upper line of a falling channel, or makes a sustained move below the lower line of a rising channel, that’s a stronger signal of a trend reversal than a breach of a simple trend line. That’s because it takes a stronger change in sentiment about an asset to reverse past an entire trading range that is of course wider than a single trend line.
For example, when price breaks down below a price rising channel, it needed enough selling pressure to move all the way down from the upper channel line to the lower one, then break below it, and thus cover a greater distance in a move that required more sustained selling pressure.
Even though trend lines are useful tools, their construction often requires a degree of subjective judgment. Different traders will draw them a bit differently, and thus won’t see s/r in the exact same place. That’s one reason why we view s/r from these trend lines as areas or bands of s/r rather than as precise lines.
Follow us on:
![]()
![]()
![]()

We hope you found our site useful and we look forward to helping you again soon!


